


前几天看了下Nacos, 今天看到监控这块,在犹豫要不要写个文章,本来官网其实已经写得很清楚了,但为了加深自己的印象,也方便日后查找,决定还是写个操作手册(ps: 附上官网地址: Nacos监控),另此处是基于 本机 Window 实现的,Linux 也是类似。
准备
- 已有整合Nacos 的项目 Nacos-demo
- 下载 prometheus (windows)
- 下载 grafana (windows)
- 另存文件 nacos-grafana.json 到本地
开启 Nacos 服务
Nacos 下载地址
Nacos 部署
注意: Nacos 部署中的配置数据源,连接的URL,用户名和密码等;
Nacos 默认启动端口为 8848 ,也可以在 nacos 目录下的 application.properties 中修改此项配置:
ps: 如果端口不冲突的情况下,不建议修改。

搭建 Nacos 集群暴露 metrics 数据
在项目配置文件 application.yml 中配置以下:
management:
  endpoints:
    web:
      exposure:
        include=*:
如果配置文件格式为 properties 格式的就配置为:
management.endpoints.web.exposure.include=*
访问http://localhost:8848/nacos/actuator/prometheus,看是否能访问到 metrics 数据(显示以下为能访问):

搭建 prometheus 采集 Nacos metrics 数据
找到最初现在的 prometheus, 此处我下载的版本为:prometheus-2.27.1.windows-amd64
1)修改配置文件 prometheus.yml 采集Nacos metrics数据:

    metrics_path: '/nacos/actuator/prometheus'

    static_configs:
    - targets: ['localhost:9090','localhost:8848']
2)启动prometheus服务
cd d/develop/prometheus-2.27.1.windows-amd64

 ./prometheus.exe --config.file=prometheus.yml
3) 后台启动成功

4)浏览器访问
浏览器访问: http://localhost:9090/graph ,在搜索栏搜索nacos_monitor可以搜索到Nacos数据说明采集数据成功:

搭建 grafana 图形化展示 metrics 数据
此处使用的版本为: grafana-7.5.7.windows-amd64.msi
安装完后后直接打开浏览器访问: http://localhost:3000 登录,默认用户和密码都为: admin。
1)配置数据源


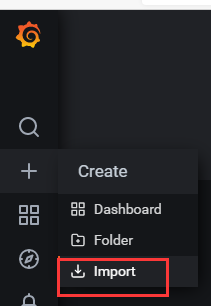
2)导入Nacos grafana监控模版
注意: 如果 Nacos 的启动端口不是 8848,需要将nacos-grafana.json 修改为当前启动端口,且 在配置 prometheus 数据源时,名称也应为 prometheus 。若不是,则也应修改为对应名称。

3)Nacos监控分为三个模块
-
nacos monitor 展示核心监控项

2.nacos detail 展示指标的变化曲线

-
nacos alert为告警项

配置grafana告警 和如何配置告警这里就不描述了。
Nacos metrics含义
1)jvm metrics

2) Nacos 监控指标

3) nacos 异常指标

4) client metrics

到文末,大家在实际操作时,更多请关注每个注意点!


 829
829


 被折叠的 条评论
为什么被折叠?
被折叠的 条评论
为什么被折叠?
 到【灌水乐园】发言


