


Numpy and Pandas
本节课中,我们主要讨论使用Numpy和pandas分析一维数据,比如电子数据表的一个单列。
使用到的数据集:Gapminder网站提供
1.不同国家的就业数据–employment levels
2.预期寿命–life expectancy
3.GDP
4.教育普及率–school completion rates
本节课不会按照数据分析的顺序进行,因为我们主要关注的是如何有效的使用Numpy and Pandas
根据这些数据,提出至少五个问题:
1.美国的就业率随时间发生了怎样的变化?—可以换成别的国家
2.在最近几年搜集的数据中,各国最高和最低的就业水平是多少?这些就业水平分别属于哪些国家?美国又处于哪一个水平?
3.也可以针对数据集中的其他变量提出此类问题?
4.这些变量间是如何相关的?
5.我还想知道各国有没有共同的持续性趋势?
例如:有没有全球性的经济衰退,如果有,我们能在数据中找到证据吗?
为什么使用pandas?
因为使用它可以很快并且简洁的写出代码?

这是在数据分析过程中的例子,导入pandas后的代码
pandas and numpy都有表示一维数据的特殊数据结构。
顺便说下numpy是 numberical python的缩写。
在pandas中,这个数据结构叫做-series,在Numpy中它叫做-array数组。
他们也有二维的数据结构–下节课会讲
我更喜欢使用pandas series,因为它比numpy数组的功能多,但是numpy数组更简单,所以我们先学这个。
pandas series是建立在numpy数组基础之上的。所以,在使用series之前,应该先掌握numpy数组。

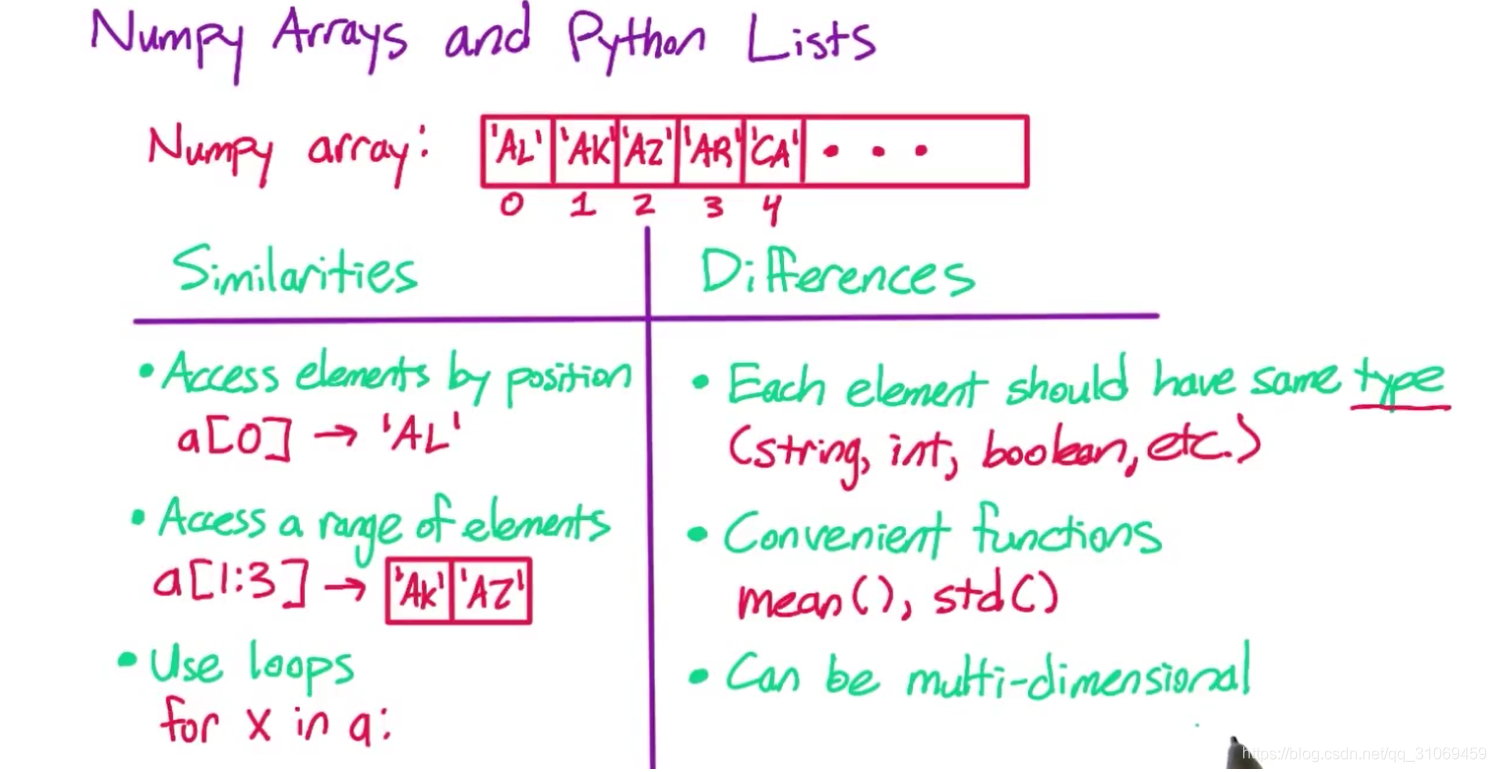
从很多方面来说,numpy数组与python列表类似
相同点:
1.它包括一个序列的元素,这些元素可以是任何数据,假如你的numpy数组是美国的州代码,那么这就是阿拉巴马,阿拉斯 加,亚利桑那,阿肯色和加利佛尼亚等等。
我在这些州上加了引号,因为它们是字符串。与列表一样,numpy数组的元素是按照顺序排列的。
2.你可以通过位置来获取元素,在这个numpy数组中,阿拉斯加的位置是0,所以如果你的numpy数组为a[0],它将会返回字符 串AL,也就是阿拉斯加。
3.此外,你也可以利用数据切片,在numpy数组中获取某一范围的元素,这里的语法跟列表的一样,上限是不包括在内的。
4.你可以在numpy数组中,用代码for x in a:使用for循环。
不同点:
1.首先,numpy数组中的各个元素都需要属于同一类别,所以各元素应该都是字符串类型,或者都是Int型,or 布尔值等等。你创建的python列表可以同时还有一些字符串,int,布尔值等多种元素混合。
你也可以在numpy中主要设置,但它的各数组被设计为仅含一种数据类型。
2.numpy有很多方便使用的函数。比如计算平均值和标准偏差的函数。在上节课中,你看到,在python列表中也可以使用这些函数。但如果你的数据是numpy数组,则函数的运行会更快。这是数据类型有所影响的地方之一。因为只有在所有元素都是值的情况下,我们才会计算数组的平均值。
3.另一个不同点是,numpy数组可以是多维的—下节学习
但是它与在python中创建一个由列表组成的列表相同。
Numpy数组
import numpy as np

# First 20 countries with employment data
##首先创建python列表,然后调用np.array,它将该列表作为参数,将其转换成numpy数组
countries = np.array([
    'Afghanistan', 'Albania', 'Algeria', 'Angola', 'Argentina',
    'Armenia', 'Australia', 'Austria', 'Azerbaijan', 'Bahamas',
    'Bahrain', 'Bangladesh', 'Barbados', 'Belarus', 'Belgium',
    'Belize', 'Benin', 'Bhutan', 'Bolivia',
    'Bosnia and Herzegovina'
])

# Employment data in 2007 for those 20 countries
employment = np.array([
    55.70000076,  51.40000153,  50.5       ,  75.69999695,
    58.40000153,  40.09999847,  61.5       ,  57.09999847,
    60.90000153,  66.59999847,  60.40000153,  68.09999847,
    66.90000153,  53.40000153,  48.59999847,  56.79999924,
    71.59999847,  58.40000153,  70.40000153,  41.20000076
])

# Change False to True for each block of code to see what it does

# Accessing elements
if True:
    print(countries[0])
    print(countries[3])

# Slicing
if True:
    print(countries[0:3])
    print(countries[:3])
    print(countries[17:])
    print(countries[:])

# Element types
if True:
    print(countries.dtype)## s代表字符串,22表示数组中最长的字符串有22个字母
    print(employment.dtype)##就业率值是浮点值,也就是它们有一个小数点,并且他们是以64位的格式存储的
    print(np.array([0, 1, 2, 3]).dtype)
    print(np.array([1.0, 1.5, 2.0, 2.5]).dtype)
    print(np.array([True, False, True]).dtype)
    print(np.array(['AL', 'AK', 'AZ', 'AR', 'CA']).dtype)

# Looping
if True:
    for country in countries:
        print('Examining country {}'.format(country))## format python字符串格式函数,它的作用是查找这些{}符号
                                         ## 然后将它们替换为格式函数format的参数

    for i in range(len(countries)):
        country = countries[i]
        country_employment = employment[i]
        print('Country {} has employment {}'.format(country,
                country_employment))

# Numpy functions
if True:
    print(employment.mean())
    print(employment.std())
    print(employment.max())
    print(employment.sum())

def max_employment(countries, employment):
    '''
    Fill in this function to return the name of the country
    with the highest employment in the given employment
    data, and the employment in that country.
    '''
    max_country = None      # 记得首先将所求值写出
    max_value = 0  # Replace this with your code

    for i in range(len(countries)):  ## range(5)===0,1,2,3,4
        country = countries[i]      ##所以这里是从countries[0]开始一直遍历,直到遇到大于max_value的值
        country_employment = employment[i]##如果country_employment的值大于max_value,则意味的employment[i],对应着是i的值大于max_value,
                                          ##同时这个i,也对应着国家的值
                                             ##以上两句代码本身就是对国家与就业两个量的连接
        if country_employment > max_value:
            max_country = country
            max_value = country_employment

    return (max_country, max_value)
Afghanistan
Angola
['Afghanistan' 'Albania' 'Algeria']
['Afghanistan' 'Albania' 'Algeria']
['Bhutan' 'Bolivia' 'Bosnia and Herzegovina']
['Afghanistan' 'Albania' 'Algeria' 'Angola' 'Argentina' 'Armenia'
'Australia' 'Austria' 'Azerbaijan' 'Bahamas' 'Bahrain' 'Bangladesh'
'Barbados' 'Belarus' 'Belgium' 'Belize' 'Benin' 'Bhutan' 'Bolivia'
'Bosnia and Herzegovina']
<U22
float64
int32
float64
bool
<U2
Examining country Afghanistan
Examining country Albania
Examining country Algeria
Examining country Angola
Examining country Argentina
Examining country Armenia
Examining country Australia
Examining country Austria
Examining country Azerbaijan
Examining country Bahamas
Examining country Bahrain
Examining country Bangladesh
Examining country Barbados
Examining country Belarus
Examining country Belgium
Examining country Belize
Examining country Benin
Examining country Bhutan
Examining country Bolivia
Examining country Bosnia and Herzegovina
Country Afghanistan has employment 55.70000076
Country Albania has employment 51.40000153
Country Algeria has employment 50.5
Country Angola has employment 75.69999695
Country Argentina has employment 58.40000153
Country Armenia has employment 40.09999847
Country Australia has employment 61.5
Country Austria has employment 57.09999847
Country Azerbaijan has employment 60.90000153
Country Bahamas has employment 66.59999847
Country Bahrain has employment 60.40000153
Country Bangladesh has employment 68.09999847
Country Barbados has employment 66.90000153
Country Belarus has employment 53.40000153
Country Belgium has employment 48.59999847
Country Belize has employment 56.79999924
Country Benin has employment 71.59999847
Country Bhutan has employment 58.40000153
Country Bolivia has employment 70.40000153
Country Bosnia and Herzegovina has employment 41.20000076
58.68500003850001
9.338269113687888
75.69999695
1173.70000077
以上定义函数的代码,如果用numpy中的求最大值函数来代替,则无法得到相应的国家名,numpy还有一个名为argmax的函数,他可以返回最大值的位置,我把这个位置命名为i,这样我就可以利用这个位置,获得国家名和就业率值了.
如下:
def max_employment2(countries,employment):
    i = employment.argmax()
    return(countries[i],employment[i])
向量化运算–vectorized operations
numpy数组的另一个优点就是,它支持向量运算,该名称取自线性代数–linear algebra
你可以将向量视为一个数字列表,例如1,2,3和4,5,6都是向量。
在线性代数中,你可以将两个长度相同的向量相加—这叫做向量加法。以上两个向量相加,结果为5,7,9
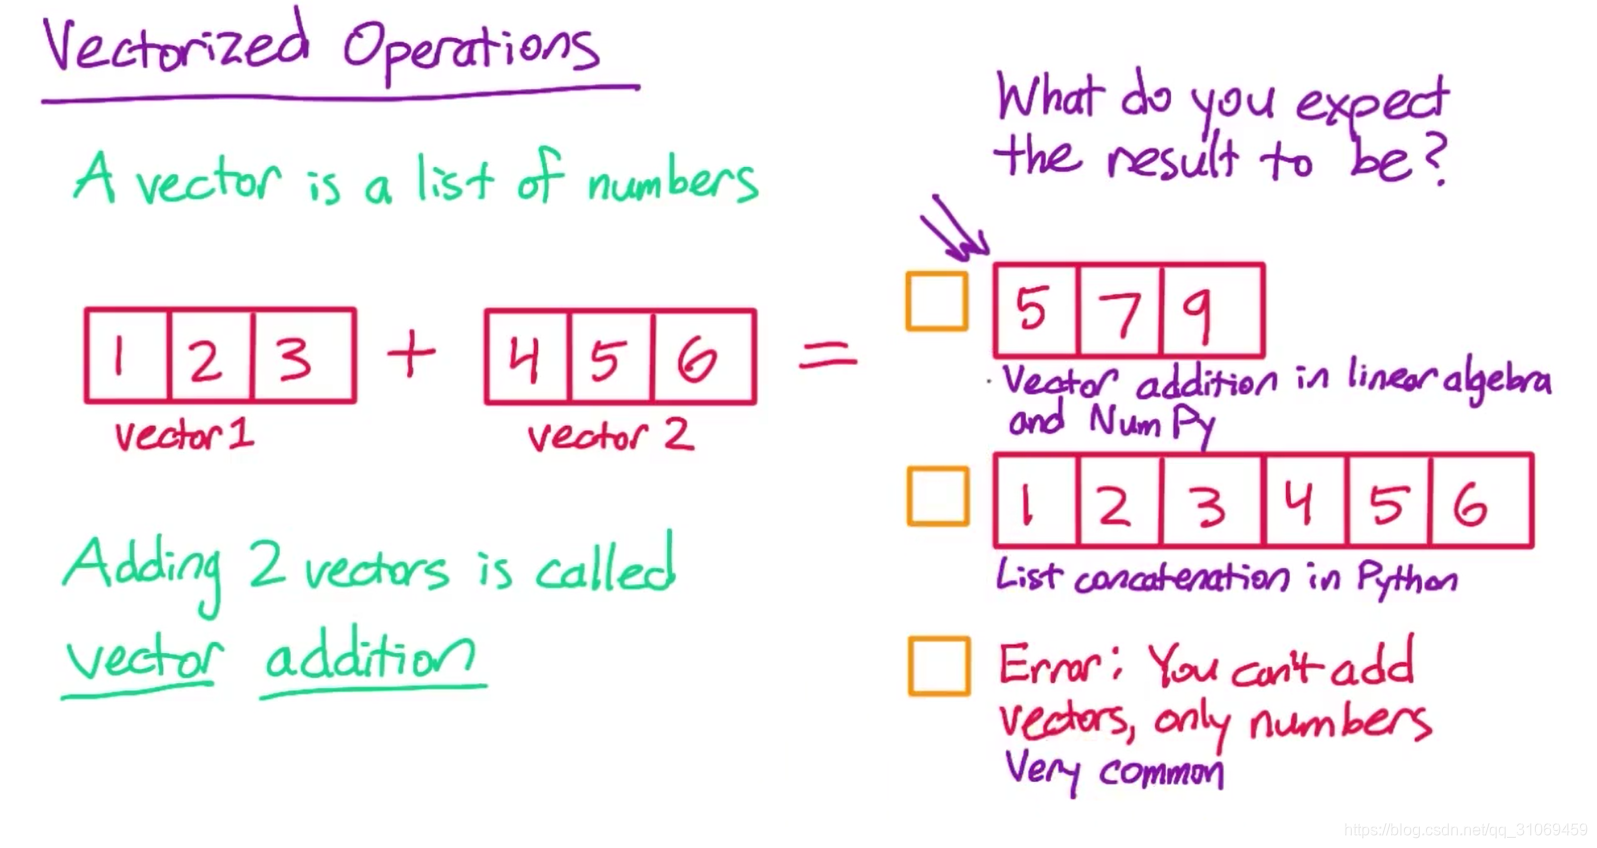
乘以标量 -Multiplying by a scalar
还有一个问题,假如你用向量乘以一个数字,即标量-scalar
如向量 1,2,3 乘以标量3后,结果为 3,6,9

更多向量运算
如果要进行逻辑运算,你需要确保你的数组含有布尔值,如果你的数组是整数,这些符号的运算就会变成,按位与,按位或和按位取反运算
位运算
查看此文章,https://en.wikipedia.org/wiki/Bitwise_operation 进一步了解位运算。
在 NumPy 中,a & b 执行 a 和 b 的“按位与”。这不一定要与执行“逻辑与”(“与”没有对应的向量版)的 a 和 b 相同。但是,如果 a 和 b 都是布尔型而非整数型数组,“按位与”和“逻辑与”的作用是一样的。
如果你想要对整数型向量进行“逻辑与”计算,你可以使用 NumPy 函数 np.logical_and(a,b),或者先把它们转换为布尔型向量。
类似地,a | b 执行“按位或”,而 ~a 执行“按位非”。但是,如果数组包含布尔值,它们与执行“逻辑或”和“逻辑非”的效果是一样的。
NumPy 也有类似的函数:逻辑或,逻辑非,用于对含整数型数值的数组进行逻辑运算。
在答案中,我们要用 / 2.,而不是 / 2。注意 2 后面有一个句点。这是因为在 Python 2 中,将一个整数除以另一个整数 (2),会舍去分数。所以如果输入是整数值,就会丢失信息。因此使用浮点数值 (2.),我们就能保留结果小数点后的值了。

import numpy as np

# Change False to True for each block of code to see what it does

# Arithmetic operations between 2 NumPy arrays
if True:
    a = np.array([1, 2, 3, 4])
    b = np.array([1, 2, 1, 2])

    print(a + b)
    print(a - b)
    print(a * b)
    print(a / b)
    print(a ** b)
[2 4 4 6]
[0 0 2 2]
[1 4 3 8]
[1. 1. 3. 2.]
[ 1 4 3 16]
# Arithmetic operations between a NumPy array and a single number
if True:
    a = np.array([1, 2, 3, 4])
    b = 2

    print(a + b)
    print(a - b)
    print(a * b)
    print(a / b)
    print(a ** b)
[3 4 5 6]
[-1 0 1 2]
[2 4 6 8]
[0.5 1. 1.5 2. ]
[ 1 4 9 16]
# Logical operations with NumPy arrays
if True:
    a = np.array([True, True, False, False])
    b = np.array([True, False, True, False])

    print(a & b)
    print(a | b)
    print(~a)

    print(a & True)
    print(a & False)

    print(a | True)
    print(a | False)
[ True False False False]
[ True True True False]
[False False True True]
[ True True False False]
[False False False False]
[ True True True True]
[ True True False False]
# Comparison operations between 2 NumPy Arrays
if True:
    a = np.array([1, 2, 3, 4, 5])
    b = np.array([5, 4, 3, 2, 1])

    print(a > b)
    print(a >= b)
    print(a < b)
    print(a <= b)
    print(a == b)
    print(a != b)
[False False False  True  True]
[False False  True  True  True]
[ True  True False False False]
[ True  True  True False False]
[False False  True False False]
[ True  True False  True  True]
# Comparison operations between a NumPy array and a single number
if True:
    a = np.array([1, 2, 3, 4])
    b = 2

    print(a > b)
    print(a >= b)
    print(a < b)
    print(a <= b)
    print(a == b)
    print(a != b)
[False False  True  True]
[False  True  True  True]
[ True False False False]
[ True  True False False]
[False  True False False]
[ True False  True  True]
# First 20 countries with school completion data
countries = np.array([
       'Algeria', 'Argentina', 'Armenia', 'Aruba', 'Austria','Azerbaijan',
       'Bahamas', 'Barbados', 'Belarus', 'Belgium', 'Belize', 'Bolivia',
       'Botswana', 'Brunei', 'Bulgaria', 'Burkina Faso', 'Burundi',
       'Cambodia', 'Cameroon', 'Cape Verde'
])

# Female school completion rate in 2007 for those 20 countries
female_completion = np.array([
    97.35583,  104.62379,  103.02998,   95.14321,  103.69019,
    98.49185,  100.88828,   95.43974,   92.11484,   91.54804,
    95.98029,   98.22902,   96.12179,  119.28105,   97.84627,
    29.07386,   38.41644,   90.70509,   51.7478 ,   95.45072
])

# Male school completion rate in 2007 for those 20 countries
male_completion = np.array([
     95.47622,  100.66476,   99.7926 ,   91.48936,  103.22096,
     97.80458,  103.81398,   88.11736,   93.55611,   87.76347,
    102.45714,   98.73953,   92.22388,  115.3892 ,   98.70502,
     37.00692,   45.39401,   91.22084,   62.42028,   90.66958
])
## 如何计算一个国家的整体教育普及率:
##假如 female = 97.4556
## male = 95.89
##整体教育普及率 overall = (female + male)/2
def overall_completion_rate(female_completion, male_completion):
    '''
    Fill in this function to return a NumPy array containing the overall
    school completion rate for each country. The arguments are NumPy
    arrays giving the female and male completion of each country in
    the same order.
    '''
    return (female_completion + male_completion) / 2
print(overall_completion_rate(female_completion,male_completion))
[ 96.416025 102.644275 101.41129 93.316285 103.455575 98.148215
102.35113 91.77855 92.835475 89.655755 99.218715 98.484275
94.172835 117.335125 98.275645 33.04039 41.905225 90.962965
57.08404 93.06015 ]
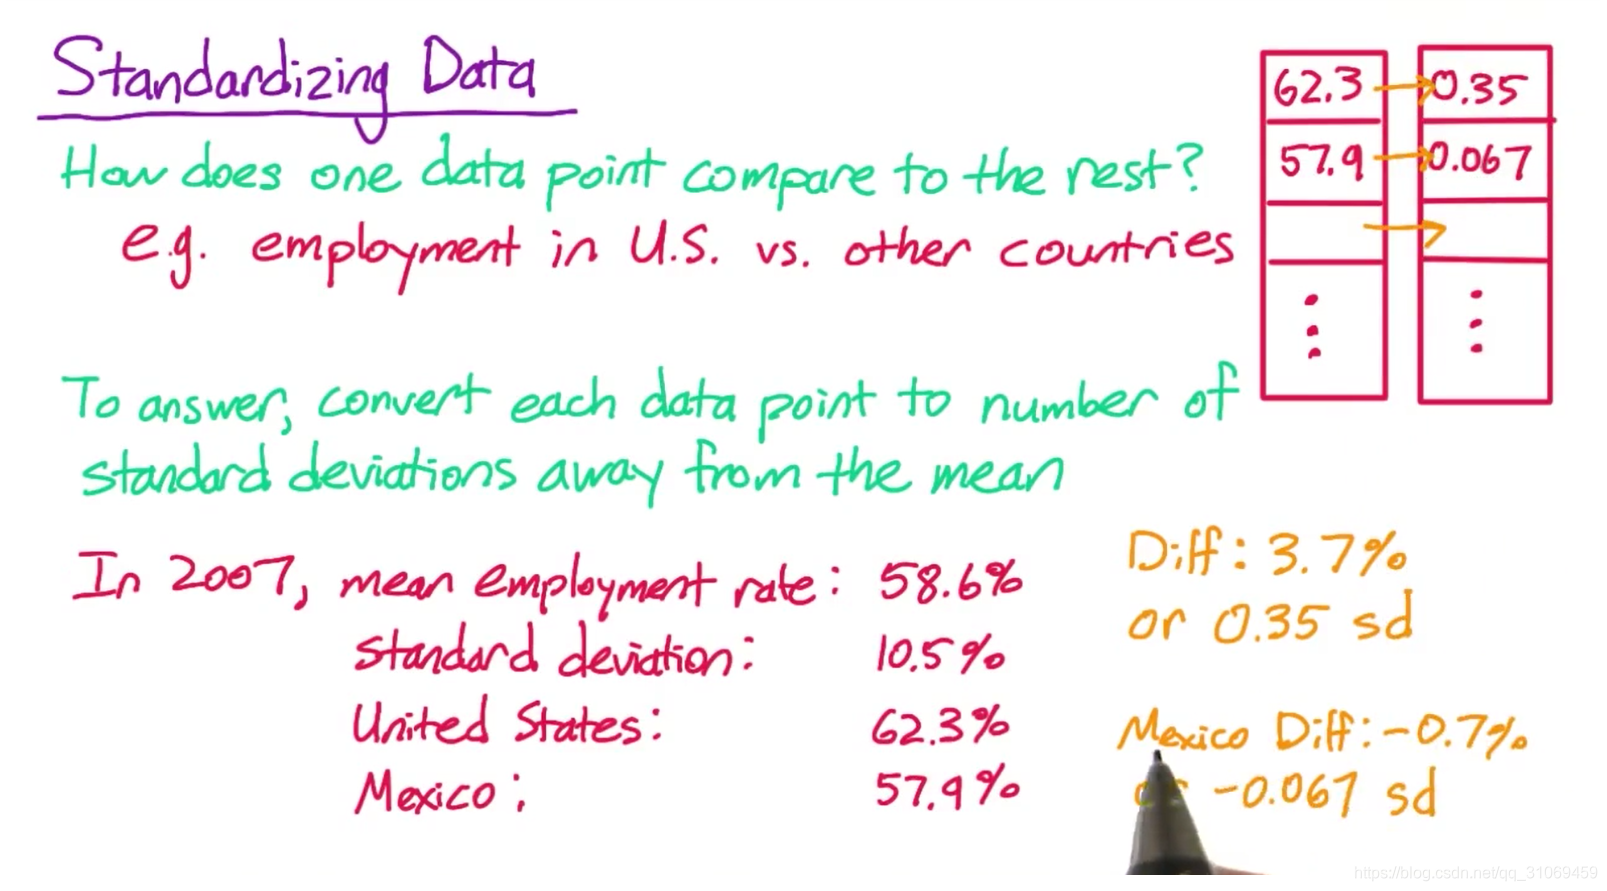
标准化数据
在数据分析中,一个常常需要回答的问题是,某一个数据点与其他数据点相比有何区别,例如:
我感兴趣的是美国就业率与其他国家就业率的差异?它比平均值更高还是更低?两者相差多少?
这个问题不是特别明确,我们对这种问题的回答,通常是将各数据点转换为相对于平均值的标准偏差值–这叫做数据标准化
比如2007年的就业数据,平均就业率是58.6%,标准偏差是10.5%,美国就业率是62.3%
那么美国就业率和平均就业率之间的差距是3.7%,这约等于0.35个标准偏差,也就是标准偏差的三分之一。
import numpy as np

# First 20 countries with employment data
countries = np.array([
    'Afghanistan', 'Albania', 'Algeria', 'Angola', 'Argentina',
    'Armenia', 'Australia', 'Austria', 'Azerbaijan', 'Bahamas',
    'Bahrain', 'Bangladesh', 'Barbados', 'Belarus', 'Belgium',
    'Belize', 'Benin', 'Bhutan', 'Bolivia',
    'Bosnia and Herzegovina'
])

# Employment data in 2007 for those 20 countries
employment = np.array([
    55.70000076,  51.40000153,  50.5       ,  75.69999695,
    58.40000153,  40.09999847,  61.5       ,  57.09999847,
    60.90000153,  66.59999847,  60.40000153,  68.09999847,
    66.90000153,  53.40000153,  48.59999847,  56.79999924,
    71.59999847,  58.40000153,  70.40000153,  41.20000076
])

# Change this country name to change what country will be printed when you
# click "Test Run". Your function will be called to determine the standardized
# score for this country for each of the given 5 Gapminder variables in 2007.
# The possible country names are available in the Downloadables section.

country_name = 'United States'
##首先要思考如何标准化一个单独的数据点,例如,对于处在位置0的值,
##首先我要计算该值与平均值之间的差距,我可以通过减法来得到这个结果
##然后我需要将其除以标准偏差,来将这个结果转换为标准偏差数量
##这样计算出单个的标准化值
#def standardize_data(values):
    #value = values[0]
    #standardized_value = (value - values.mean())/values.std()


##我可以循环对所有值进行标准化,但我要用向量运算来完成这一步
##向量运算使数组运算的代码与单值运算的代码十分相似,我直接把这个变量 value从单值改为整个数组的值
##现在的值是整个数组,平均值仍是一个单指,所以,这个减法运算是用数组中的各值去减平均值。
##标准偏差仍是一个单值,这个除法是用数组的各个元素除以标准偏差。
##由于这将数组的所有值进行了标准化,我就将这个变量改为 standardized_values 然后删除value = values[0]
def standardize_data(values):
    '''
    Fill in this function to return a standardized version of the given values,
    which will be in a NumPy array. Each value should be translated into the
    number of standard deviations that value is away from the mean of the data.
    (A positive number indicates a value higher than the mean, and a negative
    number indicates a value lower than the mean.)
    '''

    standardized_values = (values - values.mean())/values.std()
    return standardized_values
Numpy索引数组
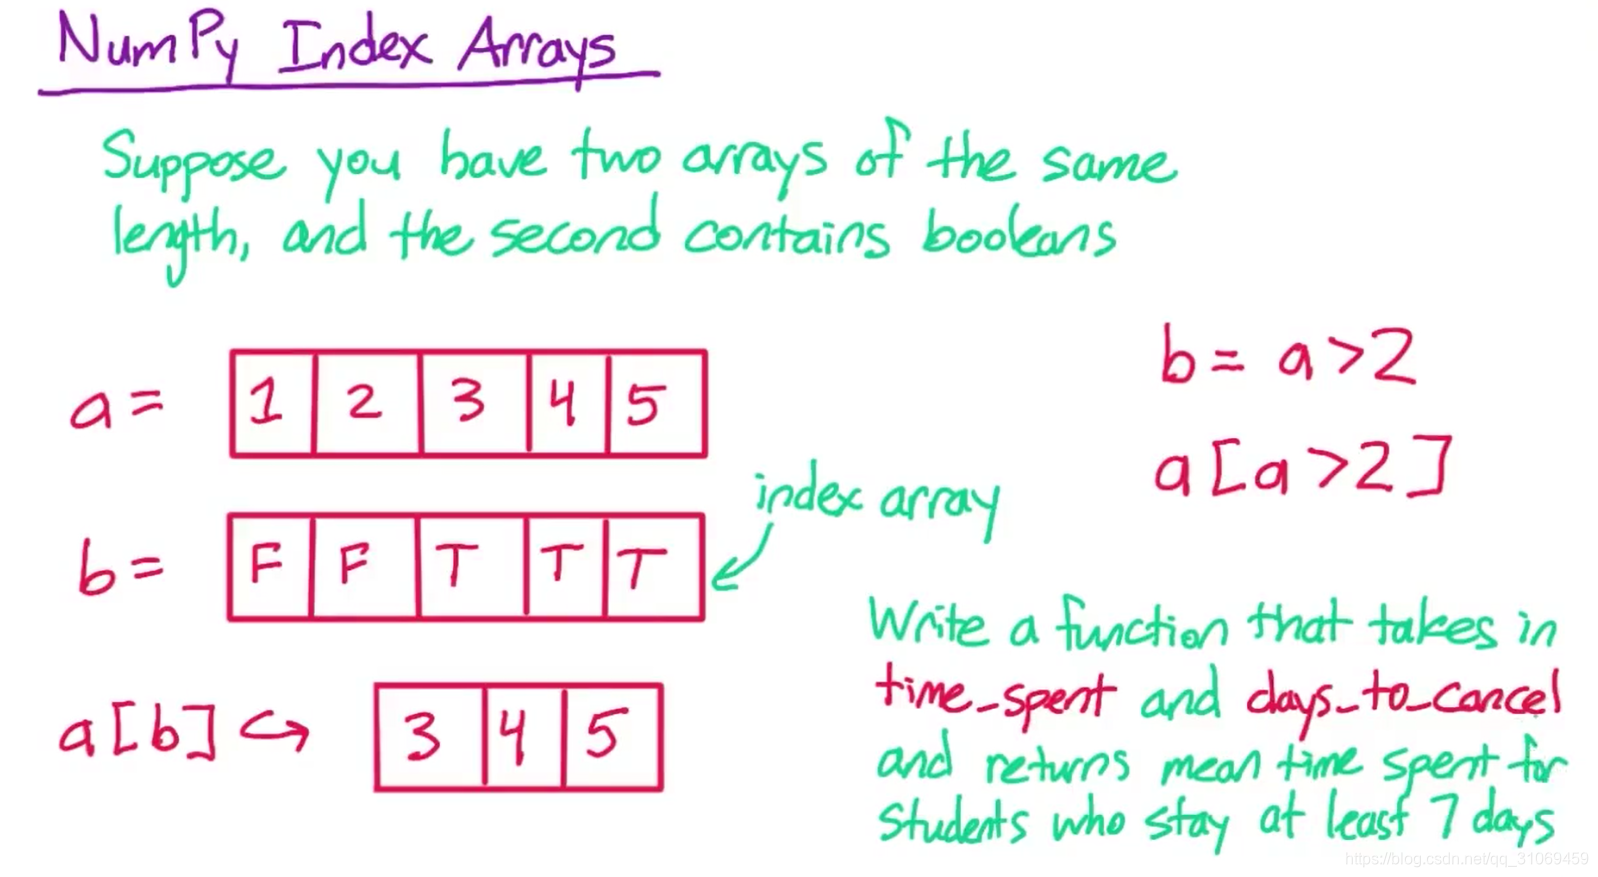
当你有两个长度相同的Numpy数组时,你还可以进行另一种计算。
这一次,第二个Numpy数组需要含有布尔值,而第一个数组可包含任何类型的数据,不仅仅是数字。
例如,假设你的第一个数组a,包含1,2,3,4,5;你的第二个数组b,包含布尔值false,false,true,true and true
那么代码a[b]将返回一个仅包含元素3,4,5的较短数组。第二个数组被称作索引数组,它告诉你应该保留第一个数组的哪些元素。
a = 1,2,3,4,5
b = F,F,T,T,T
a[b]→3,4,5
在这里,我们没有保留1,因为这一项是假值,2也是;但我们保留了3,4,5因为它们是真值。
当你把它与之前的向量运算相结合后,它的用处是很大的,在这个例子中,我保留了大于2的所有值。
所以我也可以用代码b = a>2来创建布尔数组b,我也可以在完全不使用变量b的情况下创建这个数组。
我可以利用代码a[a>2],它的结果是一样的。
a[a>2] 我认为这个简短的代码要表达的意思就是保留a数组中大于2的所有元素。
理解这个代码有点难,但是你要记住:首先,a是一个数组;
此外,你要记住,将数组与一个数字相比较,就是返回布尔数组的向量运算;
然后,你要记住,索引数组的相关知识,在你熟悉这个运算后,它可以大大提高你编写代码的速度。所有的运算都使用C语言,这个代码的运算速度比遍历快。
# Change False to True for each block of code to see what it does

# Using index arrays
if True:
    a = np.array([1, 2, 3, 4])
    b = np.array([True, True, False, False])

    print(a[b])
    print(a[np.array([True, False, True, False])])
[1 2]
[1 3]
# Creating the index array using vectorized operations
if True:
    a = np.array([1, 2, 3, 2, 1])
    b = (a >= 2)

    print(a[b])
    print(a[a >= 2])
[2 3 2]
[2 3 2]
# Creating the index array using vectorized operations on another array
if True:
    a = np.array([1, 2, 3, 4, 5])
    b = np.array([1, 2, 3, 2, 1])

    print(b == 2)
    print(a[b == 2])
[False True False True False]
[2 4]
## time_spent包含各学生第一周上课的总时间;
## days_to_cancel包含学生注销前的天数(即注册天数)
## 我需要你计算注册天数大于7的学生,第一周内上课的平均时间;
## hint:要先将days_to_cancel  转换成可以用作索引数组的布尔数组
def mean_time_for_paid_students(time_spent, days_to_cancel):
    '''
    Fill in this function to calculate the mean time spent in the classroom
    for students who stayed enrolled at least (greater than or equal to) 7 days.
    Unlike in Lesson 1, you can assume that days_to_cancel will contain only
    integers (there are no students who have not canceled yet).

    The arguments are NumPy arrays. time_spent contains the amount of time spent
    in the classroom for each student, and days_to_cancel contains the number
    of days until each student cancel. The data is given in the same order
    in both arrays.
    '''
    is_paid = days_to_cancel >= 7
    paid_time = time_spent[is_paid]
    return paid_time.mean()

# Time spent in the classroom in the first week for 20 students
time_spent = np.array([
       12.89697233,    0.        ,   64.55043217,    0.        ,
       24.2315615 ,   39.991625  ,    0.        ,    0.        ,
      147.20683783,    0.        ,    0.        ,    0.        ,
       45.18261617,  157.60454283,  133.2434615 ,   52.85000767,
        0.        ,   54.9204785 ,   26.78142417,    0.
])

# Days to cancel for 20 students
days_to_cancel = np.array([
      4,   5,  37,   3,  12,   4,  35,  38,   5,  37,   3,   3,  68,
     38,  98,   2, 249,   2, 127,  35
])
+ vs += 在Numpy中的区别

+= 运算会更改现有数组,所以在你运行这行代码之前,a和b都代表包含元素1,2,3,4的同一数组;
运行这行代码会将值更新为,2,3,4,5,所以如果打印出a或b,得到的结果是一样的,即2,3,4,5

第二种:
同样的a和b一开始都代表同一数组,但没有等号的加法运算会先创建一个新数组,新数组中的值为2,3,4,5,然后设置a等于新数组会使a指向新数组。而b仍代表之前未经更改的数组。
原地与非原地–In-Place vs Not In-Place
+= →In-Place vs + →Not In-Place
+=是原位运算,+不是原位运算。也就是说,+=会将所有的新值存储在原值所在的位置,而不是创建一个新的数组。
非原位运算很容易理解,就像你刚才看到的,当你进行原位运算时,即使看起来不会发生变化的变量也被改变了。本节课用到+较多,而不是+=。
例子:

numpy数组与python列表是不同的。最初,变量a代表数组1,2,3,4,5,但当你取数组a前三个元素的切片时,numpy并没有创建新数组。这个数据切片就是原数组的另一个视图–view。它看起来就像新数组。但如果你改变它,原数组也会改变。这使得numpy中的数据切片速度较快。因为你不需要创建新数据,或复制任何新数据。但这就要求你在更改该数据切片时,要格外谨慎。
Pandas Series
既然你们已经熟悉了numpy数组,我们来了解一下pandas series。
series与numpy数组类似,但它具有其他功能。
1.比如:如果你有一个名为s的series,那么s.series函数可以打出平均值,标准偏差,中位数以及与series有关的其它统计数据。但numpy数组没有这个函数。
2.series还有一些其他优于数组的地方—稍后讲
现在我想先讲series和数组的相同点。similarities
你刚刚学到在numpy数组上的运算,也适用于pandas series。
你可以利用中括号获取元素,
可以得到单个元素或一个元素切片。
你可以遍历series,
可以调用同样的函数。比如平均值和最大值。
你也可以用向量运算。
与numpy一样,pandas series 也使用c语言。因此它比python列表的运算更快。
import pandas as pd

countries = ['Albania', 'Algeria', 'Andorra', 'Angola', 'Antigua and Barbuda',
             'Argentina', 'Armenia', 'Australia', 'Austria', 'Azerbaijan',
             'Bahamas', 'Bahrain', 'Bangladesh', 'Barbados', 'Belarus',
             'Belgium', 'Belize', 'Benin', 'Bhutan', 'Bolivia']

life_expectancy_values = [74.7,  75. ,  83.4,  57.6,  74.6,  75.4,  72.3,  81.5,  80.2,
                          70.3,  72.1,  76.4,  68.1,  75.2,  69.8,  79.4,  70.8,  62.7,
                          67.3,  70.6]

gdp_values = [ 1681.61390973,   2155.48523109,  21495.80508273,    562.98768478,
              13495.1274663 ,   9388.68852258,   1424.19056199,  24765.54890176,
              27036.48733192,   1945.63754911,  21721.61840978,  13373.21993972,
                483.97086804,   9783.98417323,   2253.46411147,  25034.66692293,
               3680.91642923,    366.04496652,   1175.92638695,   1132.21387981]

# Life expectancy and gdp data in 2007 for 20 countries
life_expectancy = pd.Series(life_expectancy_values)
gdp = pd.Series(gdp_values)

# Change False to True for each block of code to see what it does


##200年预期寿命和GDP两个series,这两个数据及其对应的国家名称排列顺序相同。这个函数应该执行以下的简单规则。
##来检查这两个变量是否具有相关性。
##该函数将查看,当某一国家的预期寿命高于平均值时,其GDP是否也高于平均值。反之亦然。
##若预期寿命低于平均值,那么GDP是否也低于平均值。你的函数应该返回两个数字:
##第一个:两个值都低于或高于平均值的国家数量
##第二个:一个值低于平均值,另一个值高于平均值的国家数量
##所以这两个数字相加应该等于国家总数。
## hint: 在python中,你可以把布尔值相加,真值被视为1,假值被视为0.所以在python中,真值+真值 = 2
## 我会这样解决这个问题,先创建一个布尔数组,若两各个值都低于或高于平均值。则布尔值为真,否则为假。
## 然后我计算这个数组的总和,从而得出满足条件的国家数量。

def variable_correlation(variable1, variable2):
    '''
    Fill in this function to calculate the number of data points for which
    the directions of variable1 and variable2 relative to the mean are the
    same, and the number of data points for which they are different.
    Direction here means whether each value is above or below its mean.

    You can classify cases where the value is equal to the mean for one or
    both variables however you like.

    Each argument will be a Pandas series.

    For example, if the inputs were pd.Series([1, 2, 3, 4]) and
    pd.Series([4, 5, 6, 7]), then the output would be (4, 0).
    This is because 1 and 4 are both below their means, 2 and 5 are both
    below, 3 and 6 are both above, and 4 and 7 are both above.

    On the other hand, if the inputs were pd.Series([1, 2, 3, 4]) and
    pd.Series([7, 6, 5, 4]), then the output would be (0, 4).
    This is because 1 is below its mean but 7 is above its mean, and
    so on.
    '''
    both_above = (variable1 > variable1.mean()) & (variable2 > variable2.mean())##要用小括号,&&表示and
    both_below = (variable1 < variable1.mean()) & (variable2 < variable2.mean())
    is_same_direction = both_above | both_below## |表示或者 or
    num_same_direction = is_same_direction.sum()

    num_different_direction = len(variable1) - num_same_direction

    return (num_same_direction, num_different_direction)
print(variable_correlation(life_expectancy,gdp))

##运行结果,有17对数据方向相同,3对数据方向相反。大部分数据方向相同,说明这两个变量是正相关。也就是当一个值
## 较大,另一个值也会较大。若第一个数字变小,第二个数字变大,这说明变量是负相关。当一个值变大,另一个往往会变小。
## 如果两个数字大致相等,那说明两者没有太大关联。
##两个变量的关系属于,正相关和负相关的可能性是相同的。
(17, 3)
# Accessing elements and slicing
if True:
    print(life_expectancy[0])
    print(gdp[3:6])
74.7
3 562.987685
4 13495.127466
5 9388.688523
dtype: float64
# Looping
if True:
    for country_life_expectancy in life_expectancy:
        print('Examining life expectancy {}'.format(country_life_expectancy))
Examining life expectancy 74.7
Examining life expectancy 75.0
Examining life expectancy 83.4
Examining life expectancy 57.6
Examining life expectancy 74.6
Examining life expectancy 75.4
Examining life expectancy 72.3
Examining life expectancy 81.5
Examining life expectancy 80.2
Examining life expectancy 70.3
Examining life expectancy 72.1
Examining life expectancy 76.4
Examining life expectancy 68.1
Examining life expectancy 75.2
Examining life expectancy 69.8
Examining life expectancy 79.4
Examining life expectancy 70.8
Examining life expectancy 62.7
Examining life expectancy 67.3
Examining life expectancy 70.6
# Pandas functions
if True:
    print(life_expectancy.mean())
    print(life_expectancy.std())
    print(gdp.max())
    print(gdp.sum())
72.86999999999999
6.213999474869968
27036.48733192
182957.59832967006
# Vectorized operations and index arrays
if True:
    a = pd.Series([1, 2, 3, 4])
    b = pd.Series([1, 2, 1, 2])

    print(a + b)
    print(a * 2)
    print(a >= 3)
    print(a[a >= 3])
0    2
1    4
2    4
3    6
dtype: int64
0    2
1    4
2    6
3    8
dtype: int64
0    False
1    False
2     True
3     True
dtype: bool
2    3
3    4
dtype: int64
a = list(pd.Series([True, False, False, True]))
b = list(pd.Series([False, False, True, True]))
print(a + b)
[True, False, False, True, False, False, True, True]
series 索引
那么,相对于numpy数组,使用pandas series的好处是什么呢?
比如:describe 函数
但pandas series 和numpy数组的主要区别是pandas series 有索引。
让我们来看一个例子,在这节课中,我们观察了不同国家的数据,我创建了一个含有实际数据点的数组。以及另一个含有国家名的数组。
在pandas中,我只需要一个series,
然后,我可以用数据点作为series的值,用国家名作为series的索引。
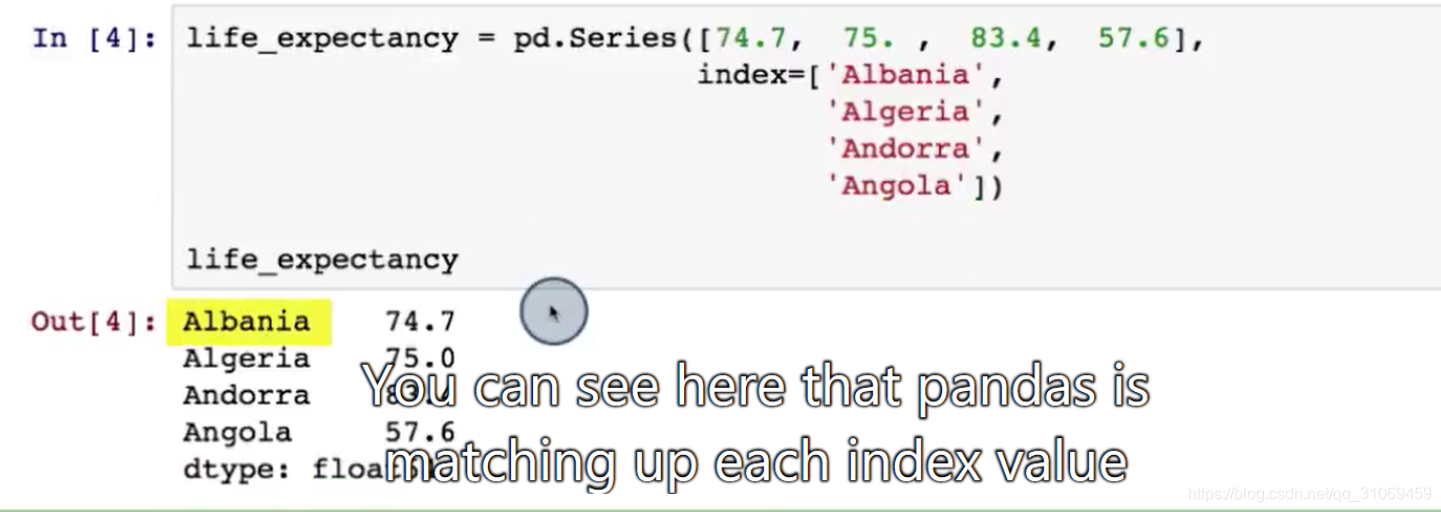
可以看到,pandas 将每个索引值,与相应的数据点进行了匹配。
我之前说过,numpy数组就是增强版的python列表。
同样的,pandas series 就像列表和字典的合集。
在列表中,元素是按顺序排列的,需要通过位置获取。你刚才看到在series中也是这样。这些值都是按顺序排列的,
你也可以通过位置来获取。
但在字典中,你需要使用关键字,比如国家名和预期寿命这样的值,你可以通过关键字来查找值。
你之前看到,预期寿命的代码为0时,我们会得到series中位置为0的预期寿命。
pandas 也有一个名为loc的属性,使你可以通过索引来查看值。如果我运行安哥拉的life_expectancy.loc 我就会看到
安哥拉的预期寿命。而不需要知道安哥拉在列表中的位置。
如果像此前一样,在不指定索引的情况下创建series会怎样?
那么数字0,1,2,3就会被默认作为索引值。

之前当我用中括号获取元素时,我是用索引还是位置来获取元素并不明确。现在你应该知道,中括号是根据位置获取元素的
因为在预期寿命series中没有索引值为0的值,在使用series时,我一般会表达的更为明确。
pandas有一个与loc属性类似的属性。它也是通过位置来获取元素 life_expectancy.iloc[0]
在这个numpy数组中,很多人会说,阿尔巴尼亚这个国家位于索引0,它们会利用中括号调用并获取,
索引至数组中的数组元素,我一直在避免使用这个术语。把它称作位置0,而不是索引0.
因为在pandas series中索引和位置有所不同。但注意,你可能会在其他地方听到索引这个数据的错误使用。

import pandas as pd

countries = [
    'Afghanistan', 'Albania', 'Algeria', 'Angola',
    'Argentina', 'Armenia', 'Australia', 'Austria',
    'Azerbaijan', 'Bahamas', 'Bahrain', 'Bangladesh',
    'Barbados', 'Belarus', 'Belgium', 'Belize',
    'Benin', 'Bhutan', 'Bolivia', 'Bosnia and Herzegovina',
]


employment_values = [
    55.70000076,  51.40000153,  50.5       ,  75.69999695,
    58.40000153,  40.09999847,  61.5       ,  57.09999847,
    60.90000153,  66.59999847,  60.40000153,  68.09999847,
    66.90000153,  53.40000153,  48.59999847,  56.79999924,
    71.59999847,  58.40000153,  70.40000153,  41.20000076,
]

# Employment data in 2007 for 20 countries
employment = pd.Series(employment_values, index=countries)

def max_employment(employment):
    '''
    Fill in this function to return the name of the country
    with the highest employment in the given employment
    data, and the employment in that country.

    The input will be a Pandas series where the values
    are employment and the index is country names.

    Try using the Pandas idxmax() function. Documention can
    be found here:
    http://pandas.pydata.org/pandas-docs/stable/generated/pandas.Series.idxmax.html
    '''
    max_country = employment.argmax()

    max_value = employment.loc[max_country]     # Replace this with your code

    return (max_country, max_value)
向量化运算和series索引
series索引对向量运算的影响非常有趣,当你将两个numpy数组相加时,由于没有索引,你相加的是同一位置的元素。
就你目前相加的这些series而言,它们的位置和索引值都是一样的,
import pandas as pd

# Change False to True for each block of code to see what it does
首先,我要看一下把两个索引值相同的series相加的结果,series1和2的索引值都是a,b,c,d.
各series的第一个元素彼此相加,其第二个元素也彼此相加,以此类推。
# Addition when indexes are the same
if True:
    s1 = pd.Series([1, 2, 3, 4], index=['a', 'b', 'c', 'd'])
    s2 = pd.Series([10, 20, 30, 40], index=['a', 'b', 'c', 'd'])
    print(s1 + s2)
a 11
b 22
c 33
d 44
dtype: int64
接下来看一下,两个series索引值相同,但顺序不同的情况,当把两个series相加时,可以看到,值的匹配是
根据索引而不是位置进行的,它没有把前两个值相加,而是把索引值为a的两个值相加。把索引值为b的两个值相加等等。
# Indexes have same elements in a different order
if True:
    s1 = pd.Series([1, 2, 3, 4], index=['a', 'b', 'c', 'd'])
    s2 = pd.Series([10, 20, 30, 40], index=['b', 'd', 'a', 'c'])
    print(s1 + s2)
a 31
b 12
c 43
d 24
dtype: int64
我们再来看看两个series索引值不同的情况,在这里series1和2都有c和d,但只有series1有a和b,而series2有e和f.
当我把两个series相加时,我看到两个series都有的c和d得到了匹配。而只有一个series有的索引值a,b,e,f,其结果均为NaN,
它代表非数字。
# Indexes overlap, but do not have exactly the same elements
if True:
    s1 = pd.Series([1, 2, 3, 4], index=['a', 'b', 'c', 'd'])
    s2 = pd.Series([10, 20, 30, 40], index=['c', 'd', 'e', 'f'])
    print(s1 + s2)
a NaN
b NaN
c 13.0
d 24.0
e NaN
f NaN
dtype: float64
因此,我大概知道,当我把索引值完全不同的两个series相加后的结果,其结果均为NaN.
# Indexes do not overlap
if True:
    s1 = pd.Series([1, 2, 3, 4], index=['a', 'b', 'c', 'd'])
    s2 = pd.Series([10, 20, 30, 40], index=['e', 'f', 'g', 'h'])
    print(s1 + s2)
a NaN
b NaN
c NaN
d NaN
e NaN
f NaN
g NaN
h NaN
dtype: float64
顺便说一下,series的其他向量运算也是这样的。值的匹配是根据索引而不是位置进行的。如果某一个索引值只存在于一个series当中,其结果值就是NaN,也就是非数字。
填充缺失值
你刚刚看到,如果把两个索引值不同的series相加,其结果就是NaN,但在大多数情况下,我可能不希望,
输出的series中出现NaN或非数字。所以我怎么样才能使结果中不出现NaN.
# Indexes overlap, but do not have exactly the same elements
if True:
    s1 = pd.Series([1, 2, 3, 4], index=['a', 'b', 'c', 'd'])
    s2 = pd.Series([10, 20, 30, 40], index=['c', 'd', 'e', 'f'])
    sum_result = s1 + s2
##方法一:得到了一个缺失值被删除的新series
sum_result.dropna()c 13.0
d 24.0
dtype: float64
##方法二:在相加之前将缺失值当作0.-----如果不会就百度
s1.add(s2,fill_value=0)
a 1.0
b 2.0
c 13.0
d 24.0
e 30.0
f 40.0
dtype: float64
Pandas Series apply()–Non Built-In-Calculation
目前为止,你始终在series上使用内置函数进行计算。例如,平均值函数和向量运算。比如代表向量加法的加号。
但如果你要进行的计算,在pandas中没有内置函数,也无法通过简单的向量运算进行,那怎么办?
与之前一样,可以将series视为列表,利用for循环,或者获取series的单个元素。
还有另外一种方法,pandas有一个名为apply的函数,你可以用它进行pandas中没有内置的计算。
apply函数会载入series和函数,然后,通过对原series的每个元素调用apply这个函数。创建一个新的series。
比如,假设把函数与3相加,也就是把数字与3相加。
对左侧series调用该函数。就会得到右侧的series。
首先,series的第一个元素与3相加,会得到4,然后再把series的第二个元素与3相加得到5.
然后,再把series的第三个元素与3相加,得到6,以此类推。

如果你熟悉python的map apply函数,两者其实是一样的,只不过这个在series而不是列表上运行。
如果你没有听说过map apply函数,也没关系,
import pandas as pd

# Change False to True to see what the following block of code does

# Example pandas apply() usage (although this could have been done
# without apply() using vectorized operations)
if True:
    s = pd.Series([1, 2, 3, 4, 5])
    def add_one(x):
        return x + 1
    print s.apply(add_one)

names = pd.Series([
    'Andre Agassi',
    'Barry Bonds',
    'Christopher Columbus',
    'Daniel Defoe',
    'Emilio Estevez',
    'Fred Flintstone',
    'Greta Garbo',
    'Humbert Humbert',
    'Ivan Ilych',
    'James Joyce',
    'Keira Knightley',
    'Lois Lane',
    'Mike Myers',
    'Nick Nolte',
    'Ozzy Osbourne',
    'Pablo Picasso',
    'Quirinus Quirrell',
    'Rachael Ray',
    'Susan Sarandon',
    'Tina Turner',
    'Ugueth Urbina',
    'Vince Vaughn',
    'Woodrow Wilson',
    'Yoji Yamada',
    'Zinedine Zidane'
])

def reverse_names(names):
    '''
    Fill in this function to return a new series where each name
    in the input series has been transformed from the format
    "Firstname Lastname" to "Lastname, FirstName".

    Try to use the Pandas apply() function rather than a loop.
    '''
    return None
在 Pandas 中绘图
如果变量 data 是一个 NumPy 数组或 Pandas Series,就像它是一个列表一样,代码
import matplotlib.pyplot as plt
plt.hist(data)
将创建数据的直方图。
Pandas 库实际上已经内置了 matplotlib 库的绘图函数。也就是说,如果对 Pandas 库中的 Series 数据绘图,不用 import matplotlib 就能完成绘图,你可以使用 data.hist() 创建直方图。另外,例子中的 seaborn 也是一种绘图样式库。
在此情形中,这两者没有区别,但有时候 Pandas 封装器更加方便。例如,你可以使用 data.plot() 创建 Series 的线条图。Series 索引被用于 x 轴,值被用于 y 轴。
在随后的测试题中,我们创建了一个 Series,其中包含本节课所涉及到的各种变量。选择你感兴趣的国家,创建每个变量随时间变化的图形。
每次你点击“测试运行”时,优达学城编辑器都将只显示一个图形。所以,你需要点击多次“测试运行”来查看多张图型。如果你在本地运行绘图代码,你可能会需要加入一行 plt.show() 代码。


 1908
1908


 被折叠的 条评论
为什么被折叠?
被折叠的 条评论
为什么被折叠?
 到【灌水乐园】发言


