


ELK收集和展示Mysql慢日志数据
1、收集需求Mysql慢日志
要求Mysql的慢日志可以有地方查询,便于开发人员分析问题;
使用的版本是filebeat-7.9.1
对应的慢日志记录如下:
# Time: 2021-08-19T05:28:13.275255+08:00
# User@Host: gtmed_wm[gtmed_wm] @  [10.152.160.184]  Id: 50278
# Schema: gtmed_wm  Last_errno: 0  Killed: 0
# Query_time: 4.434879  Lock_time: 0.000053  Rows_sent: 0  Rows_examined: 1  Rows_affected: 1
# Bytes_sent: 52
SET timestamp=1629322093;
UPDATE QRTZ_SCHEDULER_STATE SET LAST_CHECKIN_TIME = 1629322088839 WHERE SCHED_NAME = 'RuoyiScheduler' AND INSTANCE_NAME = 'gt-med-hosp-test-oss-b7c7-u
-dev-6db86c86bb-6zvzl1627890243700';
# Time: 2021-08-19T05:28:13.275265+08:00
# User@Host: gt_gmc_itg_im[gt_gmc_itg_im] @  [10.152.160.47]  Id: 43743
# Schema: gt_gmc_itg_im  Last_errno: 0  Killed: 0
# Query_time: 4.503094  Lock_time: 0.000099  Rows_sent: 0  Rows_examined: 1  Rows_affected: 1
# Bytes_sent: 52
use gt_gmc_itg_im;
SET timestamp=1629322093;
UPDATE QRTZ_SCHEDULER_STATE SET LAST_CHECKIN_TIME = 1629322088771 WHERE SCHED_NAME = 'quartzScheduler' AND INSTANCE_NAME = '9c6d2f383e2d40cabea6db030a
deaad2-devops-users-6f478d5fb4-p6w2n1627442350407';
# Time: 2021-08-19T05:28:13.275265+08:00
# User@Host: gt_gmc_itg_im[gt_gmc_itg_im] @  [10.152.160.47]  Id: 43743
# Schema: gt_gmc_itg_im  Last_errno: 0  Killed: 0
# Query_time: 4.503094  Lock_time: 0.000099  Rows_sent: 0  Rows_examined: 1  Rows_affected: 1
# Bytes_sent: 52
SET timestamp=1632462482;
UPDATE QRTZ_SCHEDULER_STATE SET LAST_CHECKIN_TIME = 1629322088771 WHERE SCHED_NAME = 'quartzScheduler' AND INSTANCE_NAME = '9c6d2f383e2d40cabea6db030a
deaad2-devops-users-6f478d5fb4-p6w2n1627442350407';
2、分析需求如何处理
通过上面的记录我们不难发现mysql慢日志是有规律的,我们可以使用filebeat的多行合并进行收集,此时需要注意的是使用# Time、# User进行合并,然后合并后再丢弃开头包括# Time;在使用logstash的Grok进行主要的正则匹配分析,最后对分析的结果入到ES集群,用户使用kibana可视化的工具进行查询和展示.
设计架构:

说明:在使用filebeat的multiline那么在用exclude_lines|include_lines过滤之前会将每个多行消息合并成一个单行。
3、filebeat收集数据
开发filebeat配置文件如下:
filebeat.inputs:
- type: log
  enabled: true
  backoff: 6s
  paths:
    - /app/logs/slowquery.*.log  #通配mysql慢查询日志
  exclude_lines: ['^\# Time','\+08:00$'] #filebeat丢弃以# Time开头或者以+08:00结尾
  multiline.pattern: '^\# User|^\# Time'  #合并以# Time或者# User 开头
  multiline.negate: true
  multiline.match: after
  multiline.max_lines: 10000
  tags: ["mysql_slowquery"]
  fields:
    log_type: mysql_slow_sql
output.file:
  path: "/tmp"
  filename: "filebeat_mysql_slow_sql.log"
此时filebeat收集的数据会输入本机的临时目录/tmp下面,可以实时验证,便于分析与开发。
启动filebeat收集上面的慢日志记录如下:
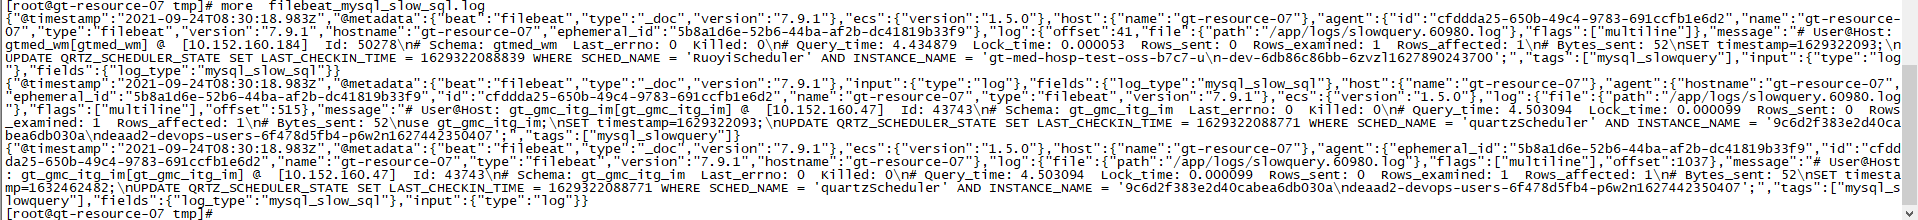
取出字段message的记录:
"message":"# User@Host: gtmed_wm[gtmed_wm] @ [10.152.160.184] Id: 50278\n# Schema: gtmed_wm Last_errno: 0 Killed: 0\n# Query_time: 4.434879 Lock_time: 0.000053 Rows_sent: 0 Rows_examined: 1 Rows_affected: 1\n# Bytes_sent: 52\nSET timestamp=1629322093;\nUPDATE QRTZ_SCHEDULER_STATE SET LAST_CHECKIN_TIME = 1629322088839 WHERE SCHED_NAME = 'RuoyiScheduler' AND INSTANCE_NAME = 'gt-med-hosp-test-oss-b7c7-u\n-dev-6db86c86bb-6zvzl1627890243700';"
此时需要分析此记录,按照我们的架构message是交给logstash处理,logstash处理这样非结构化的数据使用Grok组件;Grok开发离不开测试调试工具,我推荐 https://www.5axxw.com/tools/ 的Grok Debug
分析如下:

(?m)^#\s*User@Host:\s*%{USER:User}\[%{USER-2:User}\]\s*@\s*(?:(?<Clienthost>\S*) )?\[(?:%{IP:Client_IP})?\]\s*Id:\s*%{NUMBER:id}\s*
说明:\s* 配置空格、%{USER:User}使用内置的匹配模式去配置使用User接收,结构里面有\n建议使用空格替换 gsub => ["message","\n"," "]
匹配完成如下:


解析语句如下:
(?m)^#\s*User@Host:\s*%{USER:User}\[%{USER-2:User}\]\s*@\s*(?:(?<Clienthost>\S*) )?\[(?:%{IP:Client_IP})?\]\s*Id:\s*%{NUMBER:id}\s*#\s*Schema:\s*%{WORD:Schema}\s*Last_errno:\s*%{NUMBER:Last_errno}\s*Killed:\s*%{NUMBER:Killed}\s*#\s*+Query_time:\s*%{NUMBER:Query_time}\s*+Lock_time:\s*%{NUMBER:Lock_time}\s*+Rows_sent:\s*%{NUMBER:Rows_sent}\s*+Rows_examined:\s*%{NUMBER:Rows_examined}\s*+Rows_affected:\s*%{NUMBER:Rows_affected}\s*#\s*Bytes_sent:\s*%{NUMBER:Bytes_sent}\s*SET\s*timestamp=%{NUMBER:timestamp};\s*(?<Query>(?<Action>\w+)\s+.*)
注意:此处是一行的记录
细心的朋友会发现,上面的慢SQL中有一行中多use gt_gmc_itg_im; 我们解析message也要多一个,解析记录如下:
(?m)^#\s*User@Host:\s*%{USER:User}\[%{USER-2:User}\]\s*@\s*(?:(?<Clienthost>\S*) )?\[(?:%{IP:Client_IP})?\]\s*Id:\s*%{NUMBER:id}\s*#\s*Schema:\s*%{WORD:Schema}\s*Last_errno:\s*%{NUMBER:Last_errno}\s*Killed:\s*%{NUMBER:Killed}\s*#\s*+Query_time:\s*%{NUMBER:Query_time}\s*+Lock_time:\s*%{NUMBER:Lock_time}\s*+Rows_sent:\s*%{NUMBER:Rows_sent}\s*+Rows_examined:\s*%{NUMBER:Rows_examined}\s*+Rows_affected:\s*%{NUMBER:Rows_affected}\s*#\s*Bytes_sent:\s*%{NUMBER:Bytes_sent}\s*use\s*%{WORD:use};\s*SET\s*timestamp=%{NUMBER:timestamp};\s*(?<Query>(?<Action>\w+)\s+.*)
注意:此处是一行的记录
4、logstash过滤
开发logstash配置文件如下:
[root@gt-resource-09 logs]# more  /usr/local/logstash-7.9.1/config/conf.d/input_filebeat_output_es.conf.20210924
input {
        beats {
                port => 5044
              }
}


#filter {
#    json {
#        source => "message"
#    }
#}
filter {

  mutate {
                gsub => ["message","\n"," "]
        }
  grok {
                match => {

                 "message" => "(?m)^#\s*User@Host:\s*%{USER:User}\[%{USER-2:User}\]\s*@\s*(?:(?<Clienthost>\S*) )?\[(?:%{IP:Client_IP})?\]\s*Id:\s*%{NUMBER:id}\s*#\s*Schema:\s*%{WORD:Schema}\s*Last_errno:\s*%{NUMBER:Last_errno}\s*Killed:
\s*%{NUMBER:Killed}\s*#\s*+Query_time:\s*%{NUMBER:Query_time}\s*+Lock_time:\s*%{NUMBER:Lock_time}\s*+Rows_sent:\s*%{NUMBER:Rows_sent}\s*+Rows_examined:\s*%{NUMBER:Rows_examined}\s*+Rows_affected:\s*%{NUMBER:Rows_affected}\s*#\s*Bytes_sen
t:\s*%{NUMBER:Bytes_sent}\s*SET timestamp=%{NUMBER:timestamp};\s*(?<Query>(?<Action>\w+)\s+.*)"
                }
                match => {
                 "message" => "(?m)^#\s*User@Host:\s*%{USER:User}\[%{USER-2:User}\]\s*@\s*(?:(?<Clienthost>\S*) )?\[(?:%{IP:Client_IP})?\]\s*Id:\s*%{NUMBER:id}\s*#\s*Schema:\s*%{WORD:Schema}\s*Last_errno:\s*%{NUMBER:Last_errno}\s*Killed:
\s*%{NUMBER:Killed}\s*#\s*+Query_time:\s*%{NUMBER:Query_time}\s*+Lock_time:\s*%{NUMBER:Lock_time}\s*+Rows_sent:\s*%{NUMBER:Rows_sent}\s*+Rows_examined:\s*%{NUMBER:Rows_examined}\s*+Rows_affected:\s*%{NUMBER:Rows_affected}\s*#\s*Bytes_sen
t:\s*%{NUMBER:Bytes_sent}\s*use\s*%{WORD:use};\s*SET\s*timestamp=%{NUMBER:timestamp};\s*(?<Query>(?<Action>\w+)\s+.*)"
               }

       }

date {
            match => ["timestamp","UNIX", "YYYY-MM-dd HH:mm:ss"]
            target => "@timestamp"
            timezone => "Asia/Shanghai"
  }
mutate {
#       add_field => {"host_name" => "%{[host][name]}"}
        rename => {"[log][file][path]" => "log_path"}
        rename => {"[host][name]" => "hostname"}
        split => ["log_path", "."]
        remove_field => ["input","agent","ecs","tags","log","host"]
        convert => ["Lock_Time","float"]
        convert => ["Query_Time","float"]
        add_field => { "target_index" => "logstash-mysql-slow-%{+YYYY.MM.dd}" }
        add_field => {"mysql_port" => "%{[log_path][1]}"}
     }

}

output {
#      stdout{
#                codec=> rubydebug
#            }
        elasticsearch {
                hosts => ["10.152.160.41:60982","10.152.160.40:60982"]
                index => "%{[hostname]}_%{[mysql_port]}"
        }
        stdout {
                codec => "rubydebug"
        }

}

[root@gt-resource-09 logs]#
效果如下:


5、大屏报表展示


 3726
3726


 被折叠的 条评论
为什么被折叠?
被折叠的 条评论
为什么被折叠?
 到【灌水乐园】发言


