


async-profiler
async-profiler是一个对系统性能影响很少的Java采样分析器,它的实现是基于HotSpot特有的API,通过这些特有的API收集堆栈跟踪和跟踪内存分配。
Async-profiler可以跟踪以下类型的事件:
- CPU周期
- 硬件和软件性能计数器,如缓存未命中、分支未命中、页面错误、上下文切换等
- Java堆中的分配
- Java对象监视器和可重入锁等
github地址:https://github.com/jvm-profiling-tools/async-profiler
async-profiler
Usage: ./profiler.sh [action] [options] <pid>
Actions:
  start             start profiling and return immediately
  stop              stop profiling
  status            print profiling status
  list              list profiling events supported by the target JVM
  collect           collect profile for the specified period of time
                    and then stop (default action)
Options:
  -e event          profiling event: cpu|alloc|lock|cache-misses etc.
  -d duration       run profiling for <duration> seconds
  -f filename       dump output to <filename>
  -i interval       sampling interval in nanoseconds
  -b bufsize        frame buffer size
  -t                profile different threads separately
  -o fmt[,fmt...]   output format: summary|traces|flat|collapsed

<pid> is a numeric process ID of the target JVM
      or 'jps' keyword to find running JVM automatically using jps tool

Example: ./profiler.sh -d 30 -f profile.fg -o collapsed 3456
         ./profiler.sh start -i 999000 jps
         ./profiler.sh stop -o summary,flat jps
Flame Graphs (火焰图)
火焰图是svg 格式的矢量图,是先通过perf 等工具分析得到结果,并将该结果生成的具有不同层次且支持互动的图片,看起来就像是火焰,这也是它的名字的由来。
github地址:https://github.com/brendangregg/FlameGraph
实战分析
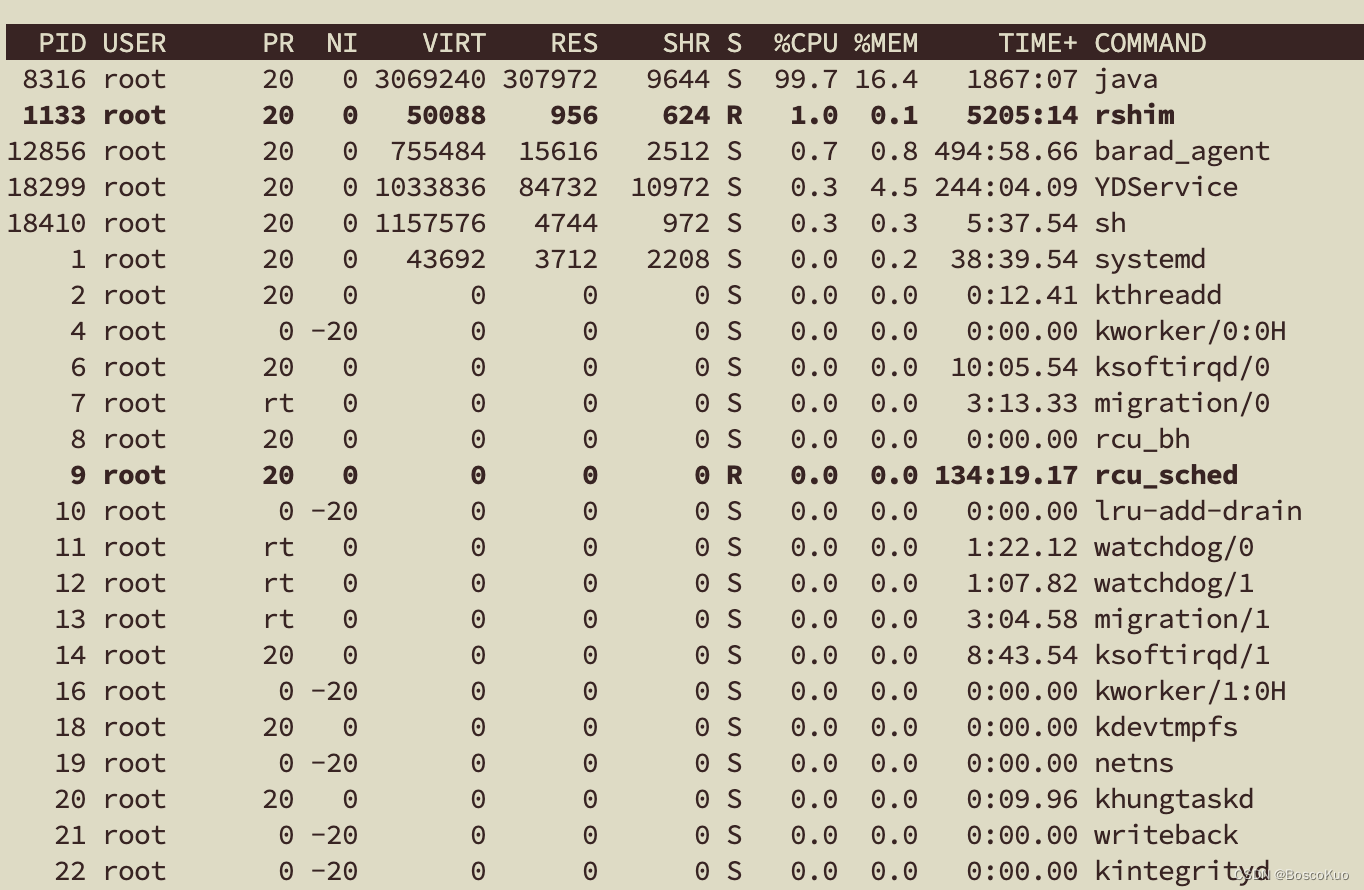
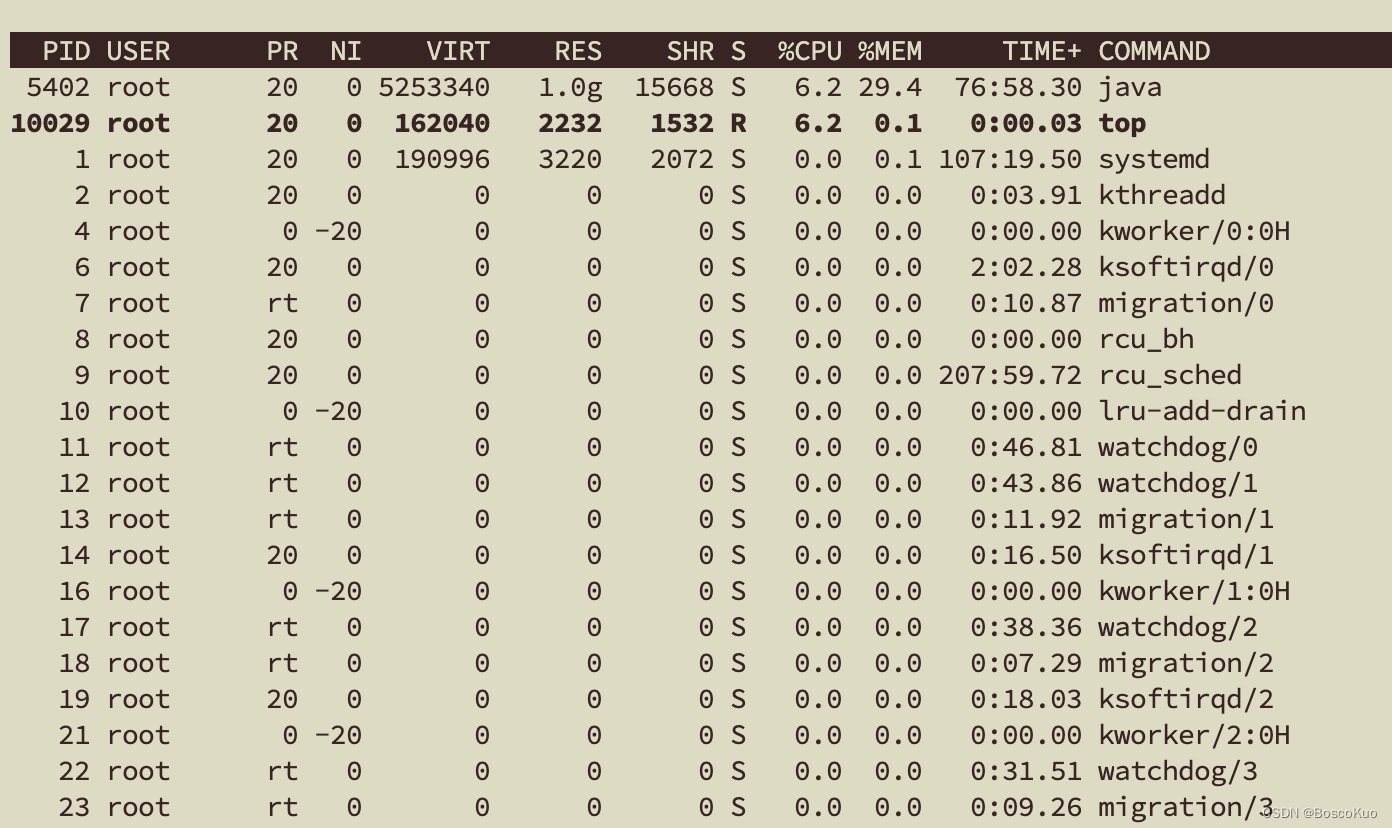
线上运行项目,通过 top 命令发现,cpu 的使用率一直是 100%,下面记录一次分析和解决问题的过程。
jstack
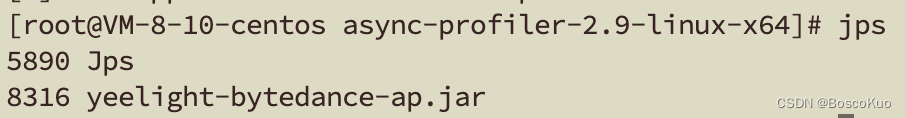
查询pid
## 安装 Java 环境变量,可使用 jps
jps
## ps常规查询
ps -ef | grep 项目名
显示进程下的线程
top -Hp pid
pid:进程 id,对应上图的 8316
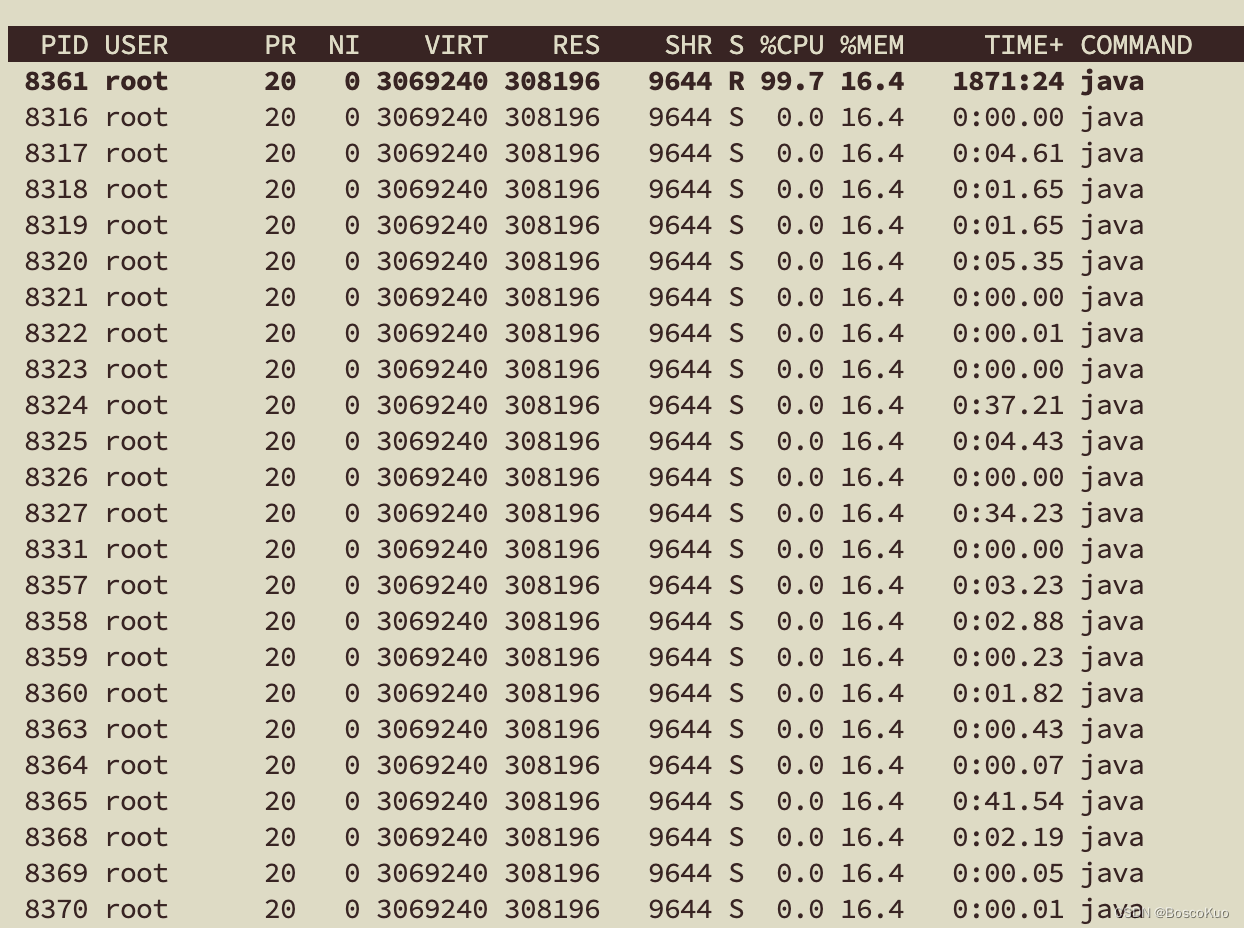
10 进制转换16 进制
printf "%x\n" tid
tid:占用 cpu 率高的线程,对应上图中的8361

jstack 打印线程信息
jstack 8316 | grep '20a9' -A50 >> 8361.log
下图即为 8361.log内容
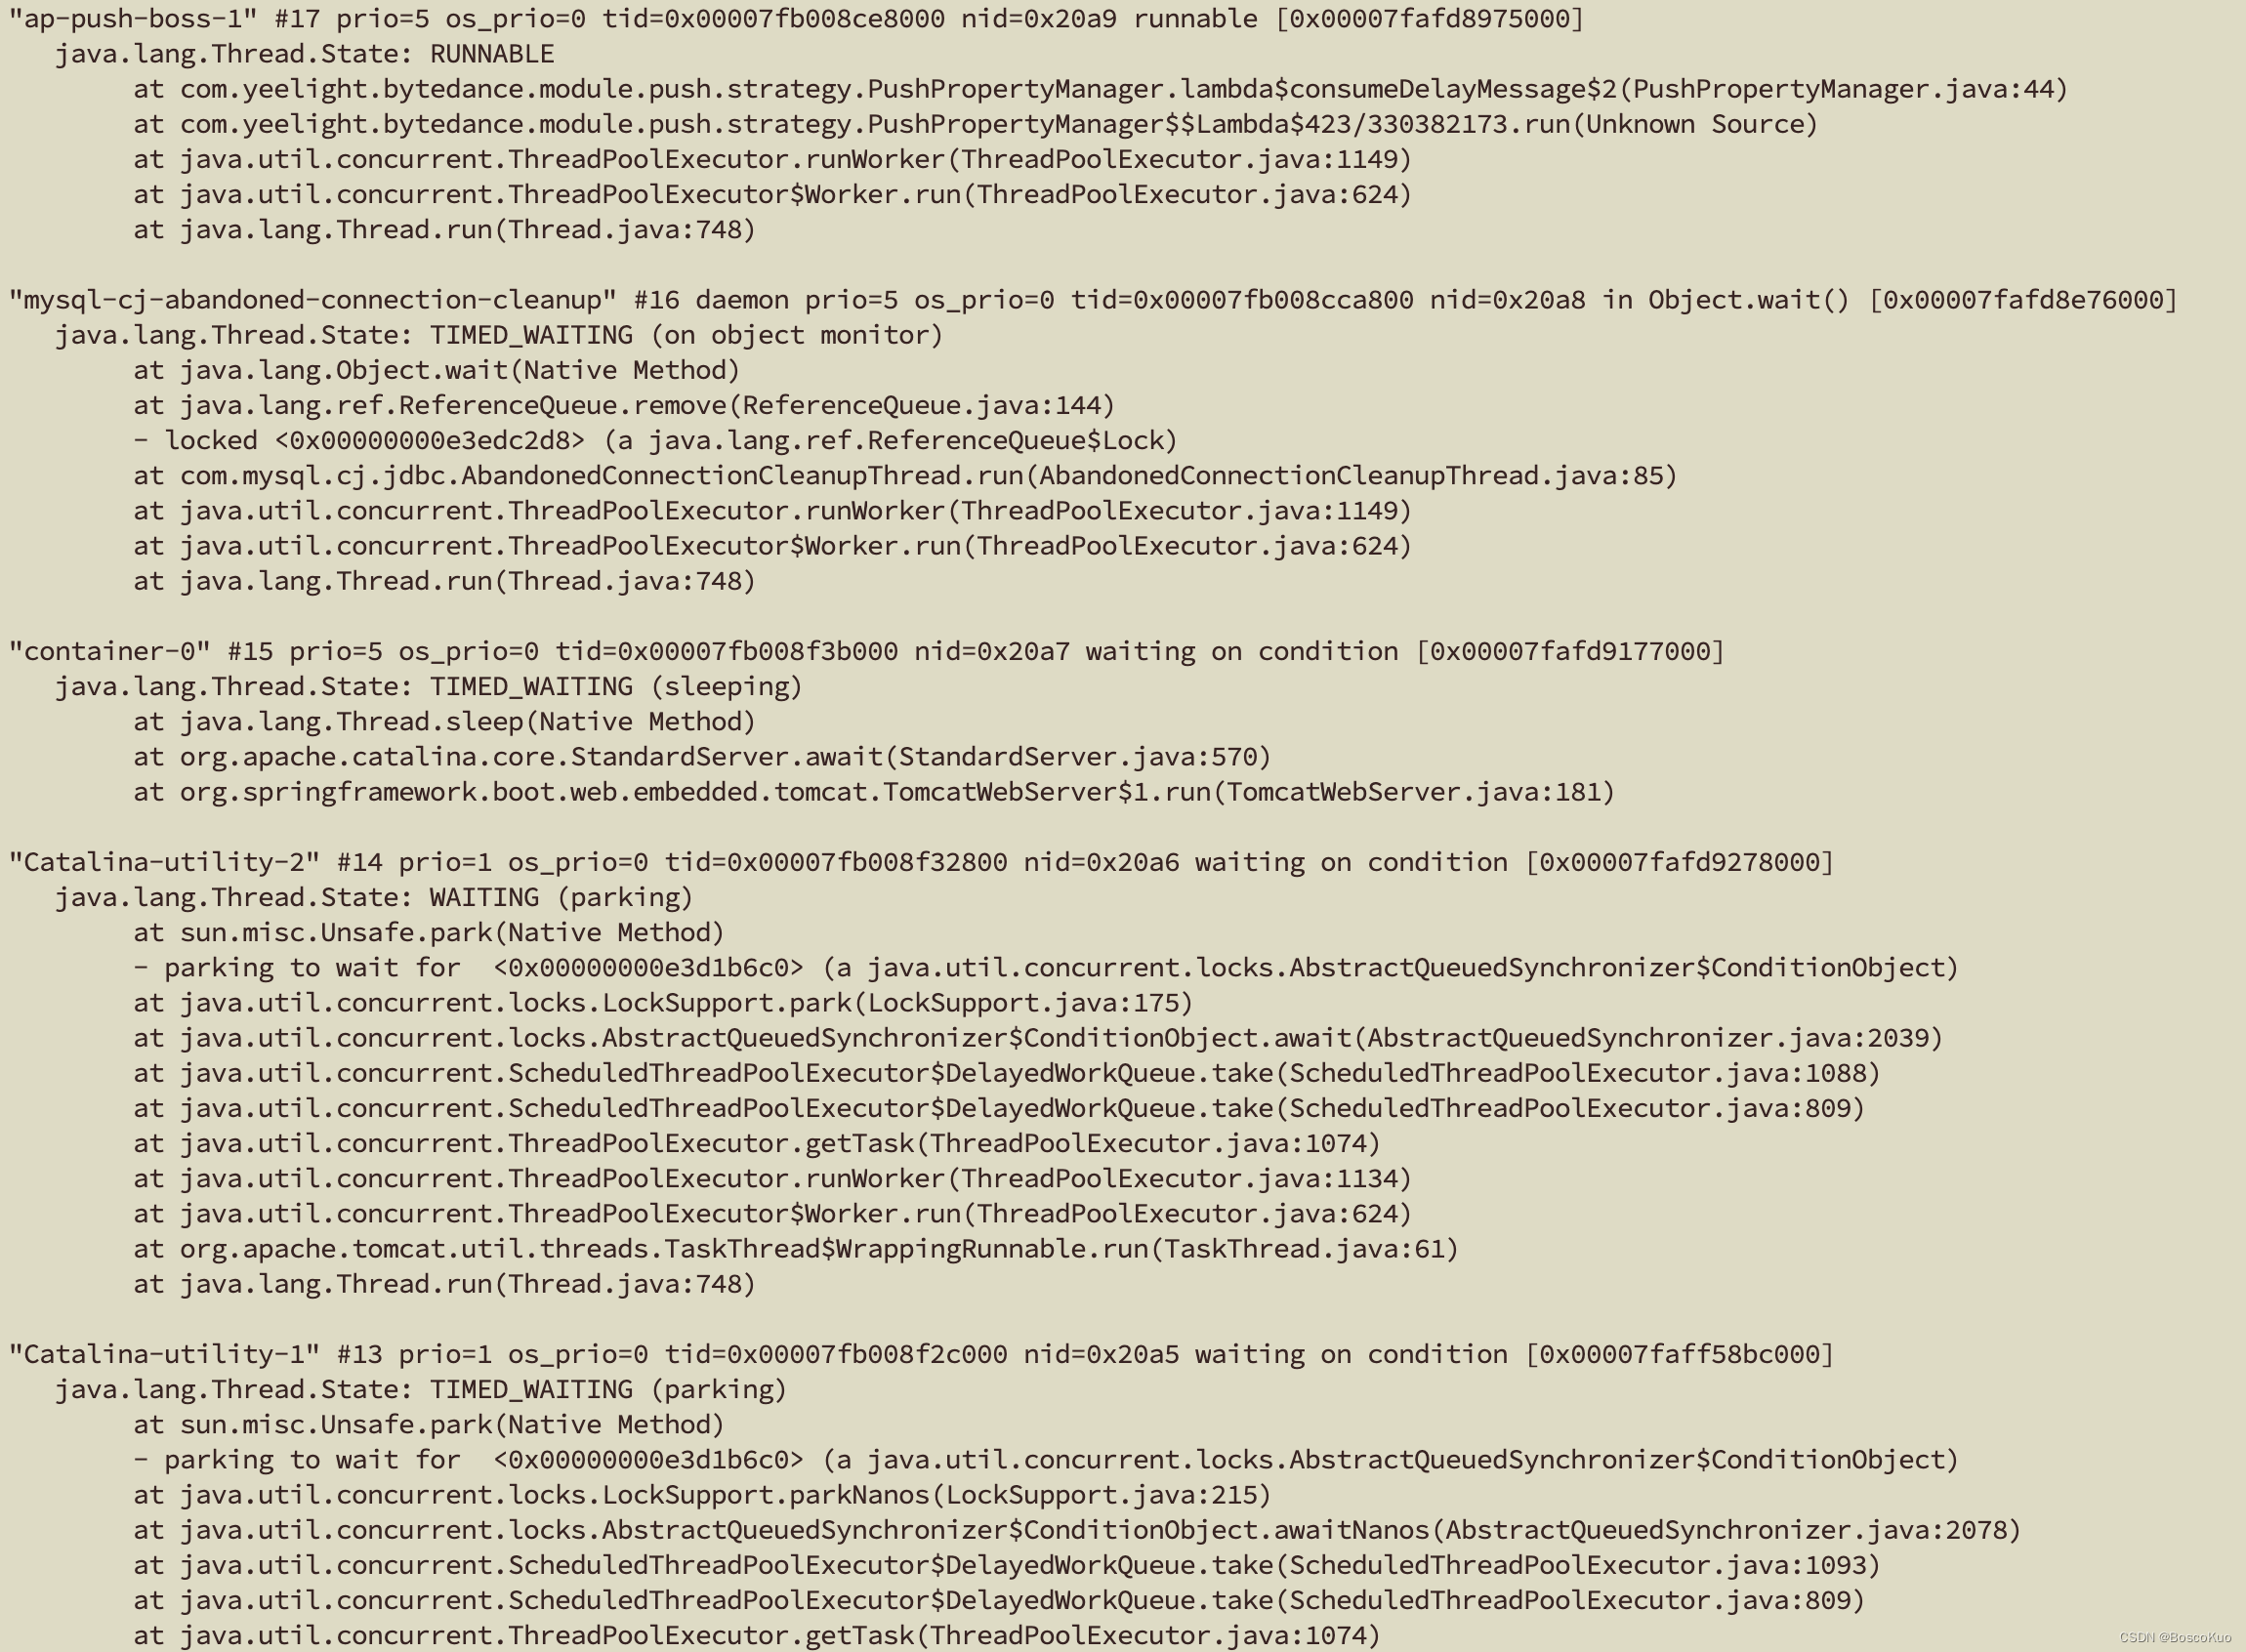
仅从上图分析,无法看出该线程问题。
async-profiler
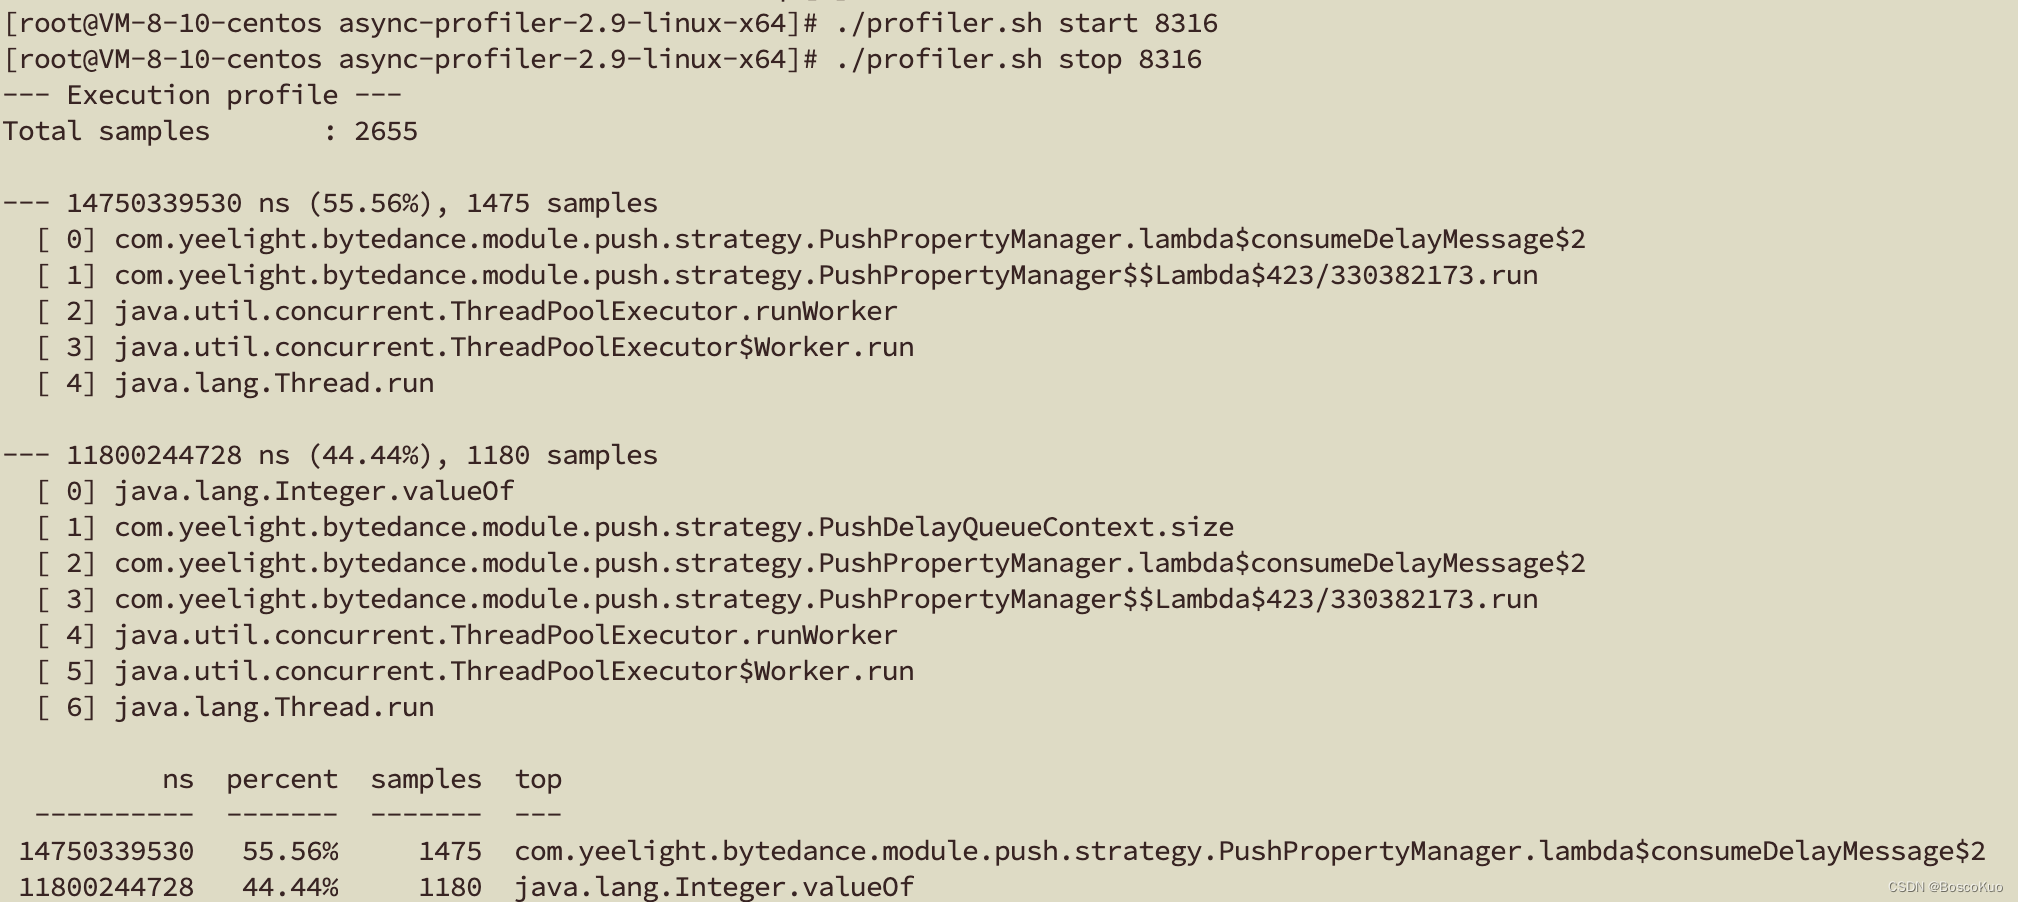
cpu profile数据采集
## 开启
./profiler.sh start $pid
## 关闭
./profiler.sh stop $pid
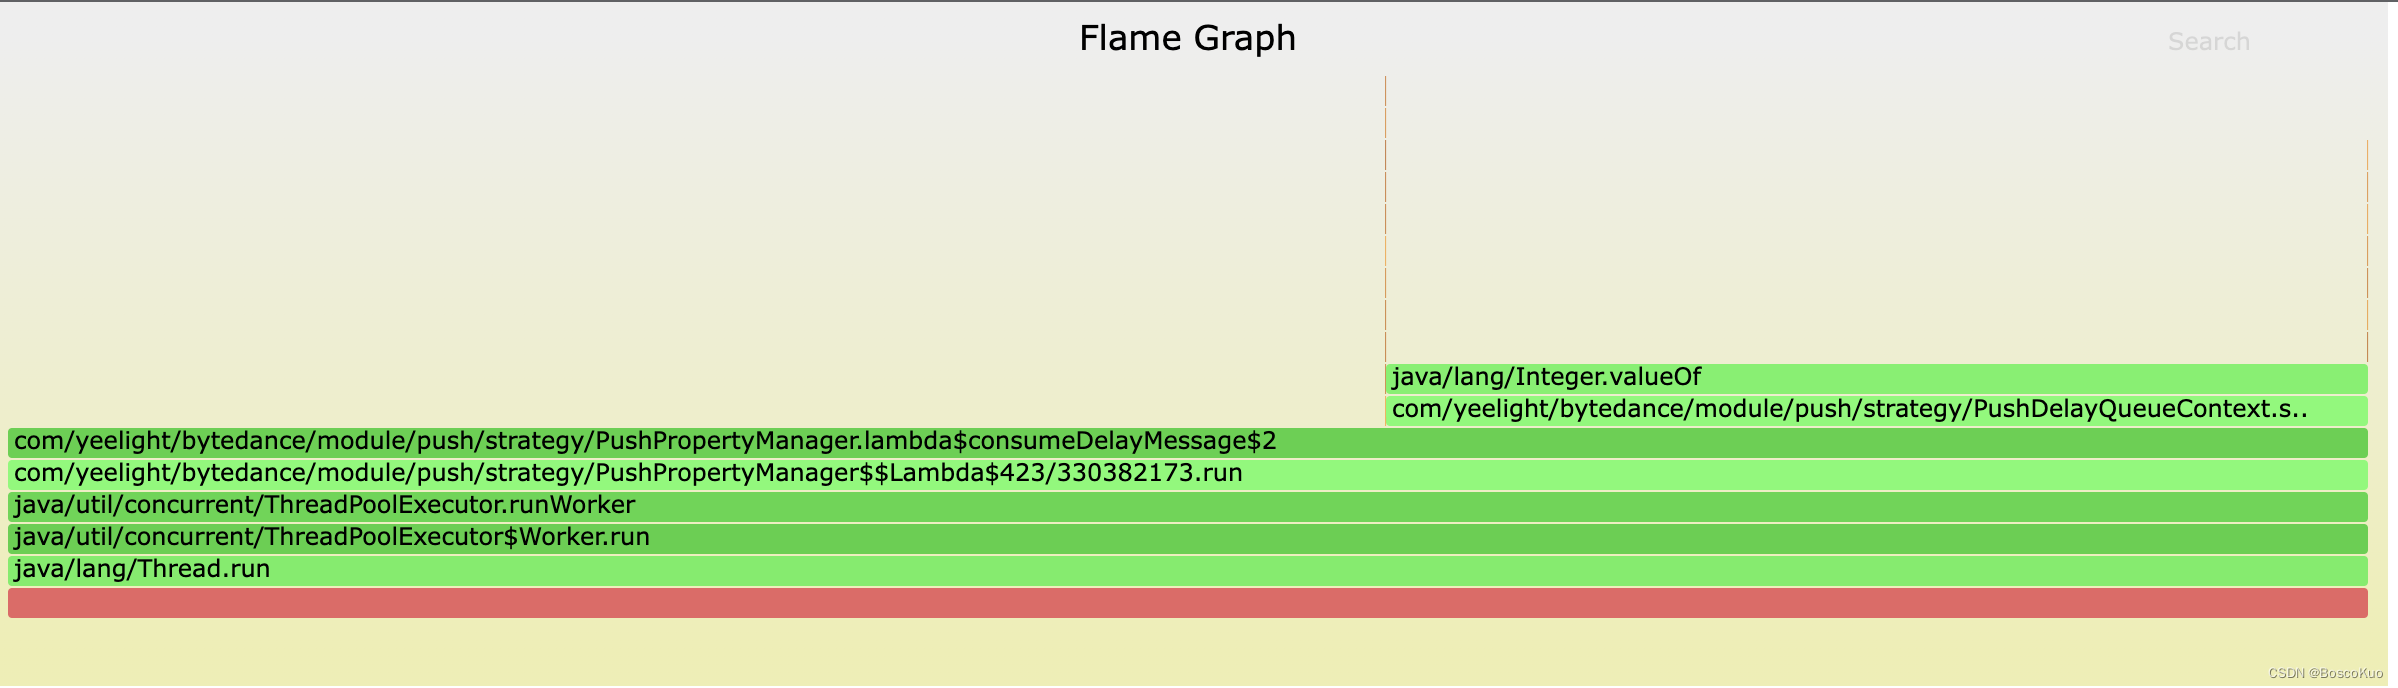
通过Flame Graphs分析
./profiler.sh -d 60 -o collapsed -f /root/collapsed.txt pid
采集数据的时间为60秒,将数据按照collapsed规范进行dump,保存到/root/collapsed.txt,60秒之后,工具会自动停止,并且将cpu的profile数据dump到/root/collapsed.txt,需要使用Flame Graphs工具来进行加工。
./flamegraph.pl --colors=java /root/collapsed.txt > collapsed.svg
结合代码分析
优化前代码
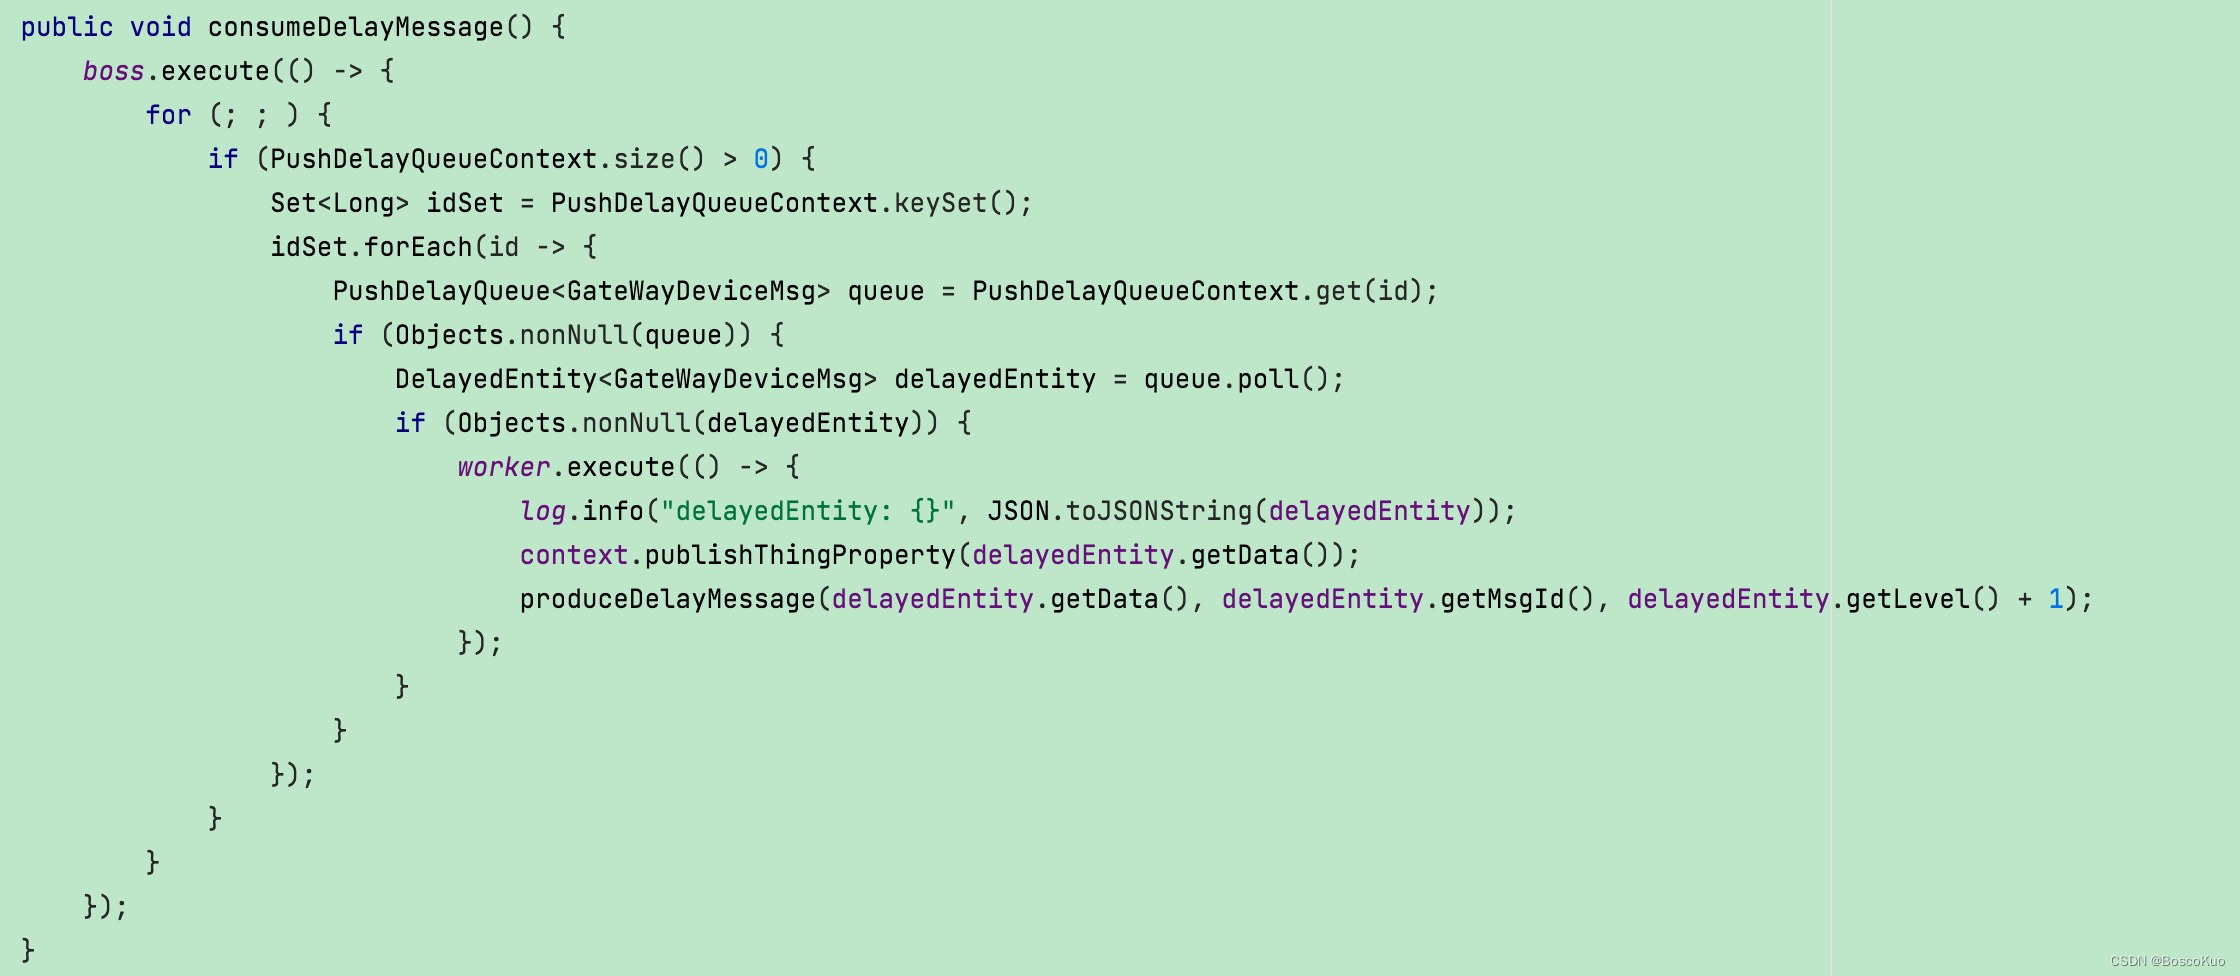
此时可以定位到,boss 线程可能一直在空转,一直不停的执行逻辑,却没有任何数据返回。
优化后代码
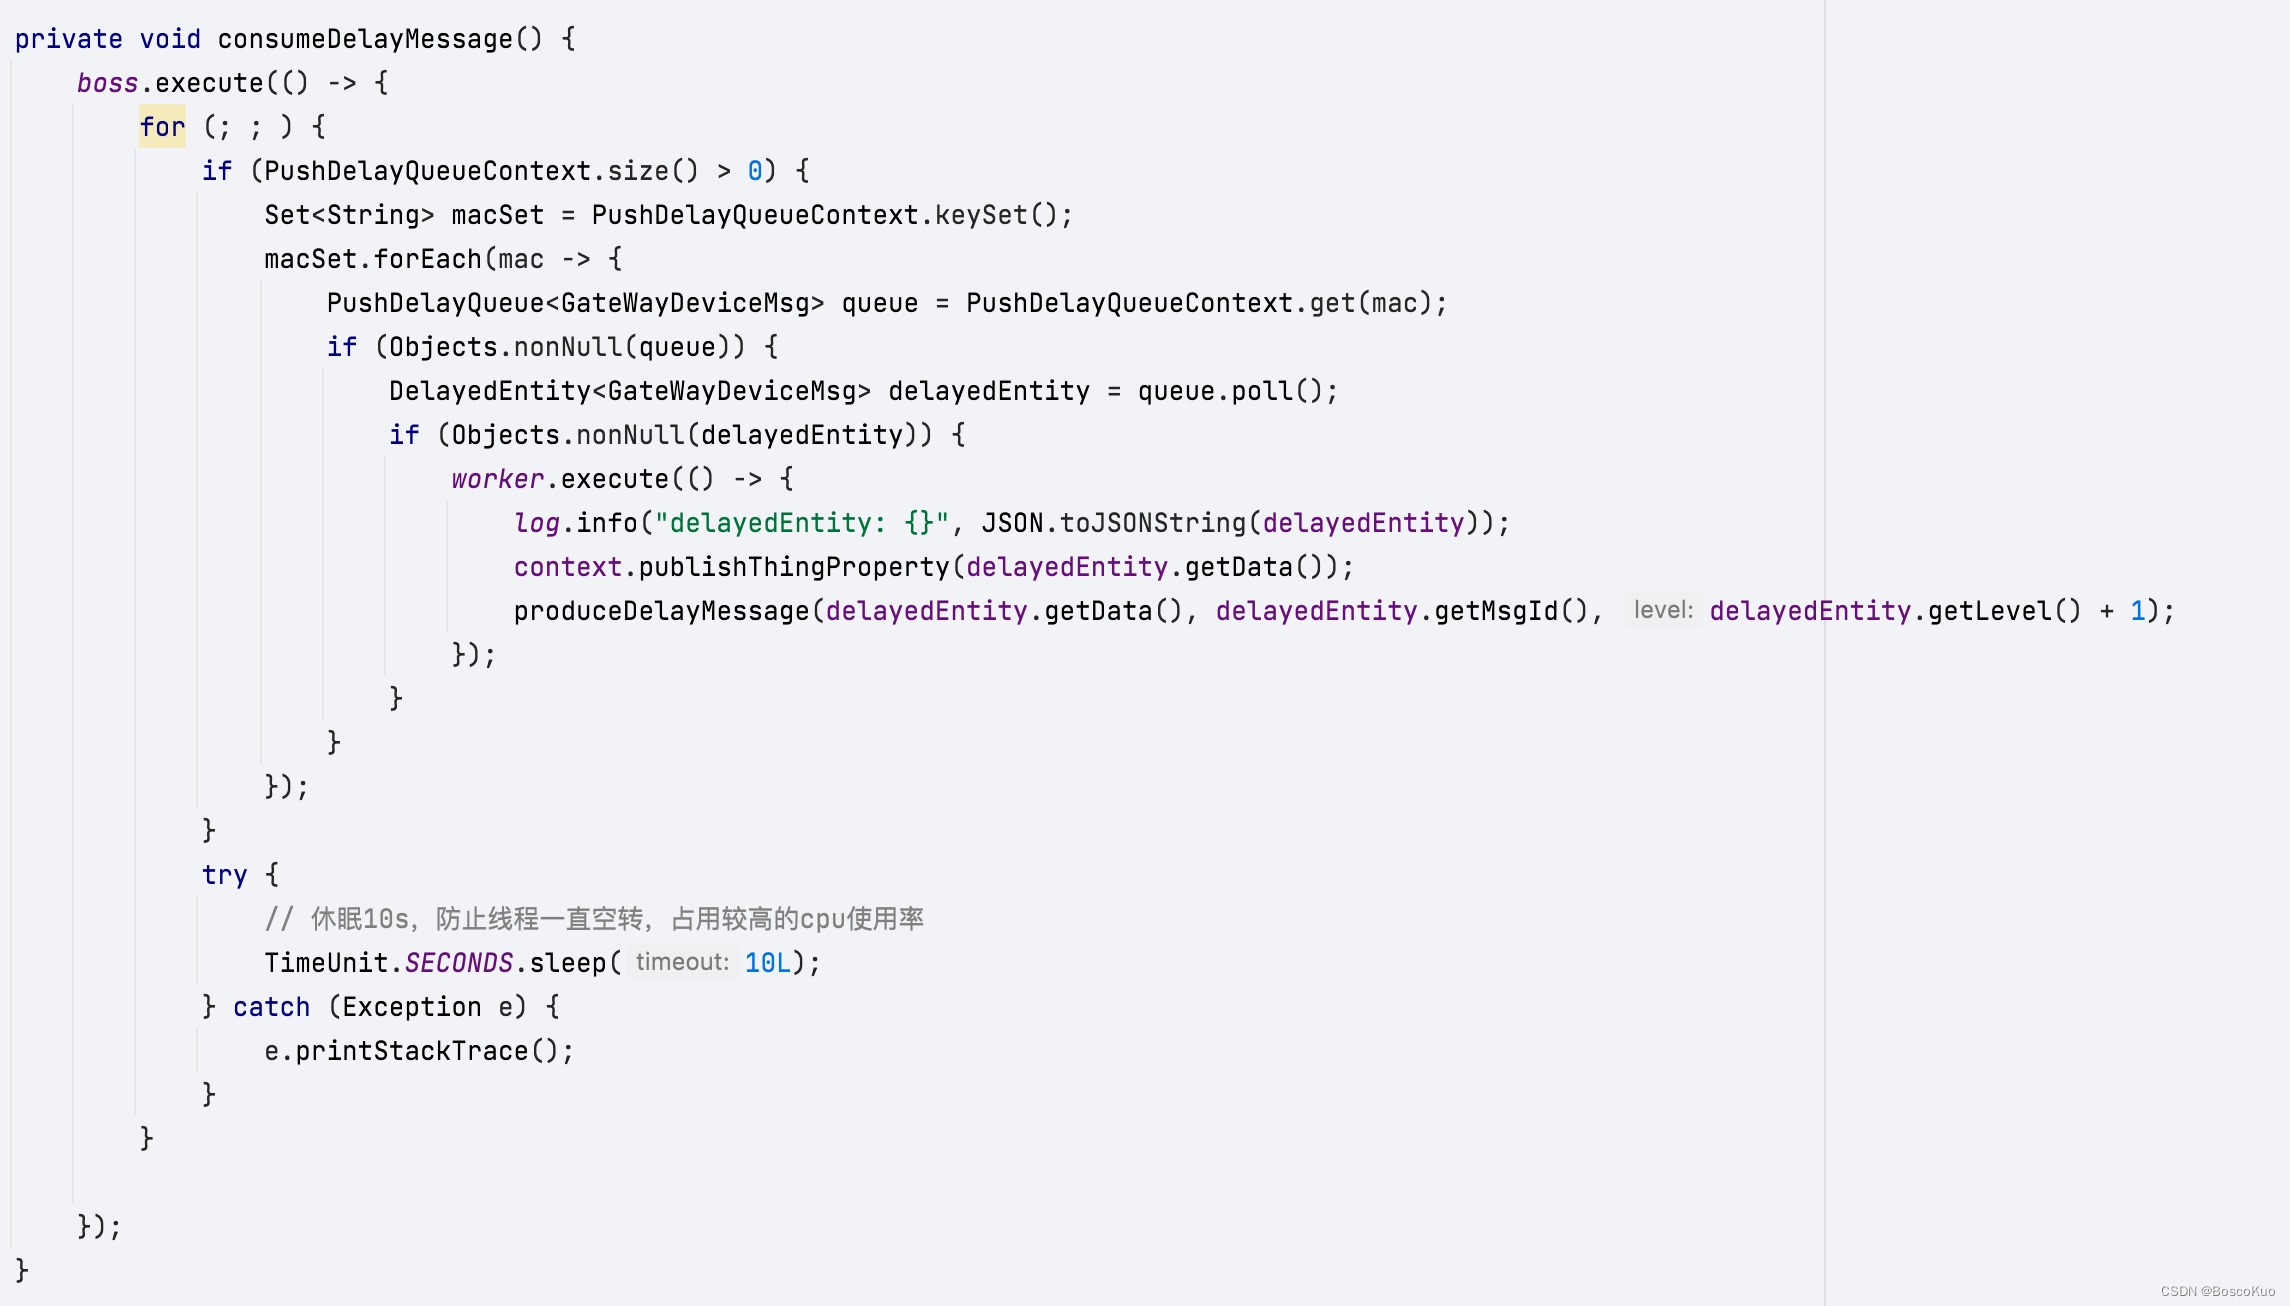
避免空转,boss 线程休眠 10s。
效果明显,cpu 使用率降下来了。
总结
通过jstack 和 async-profiler,定位到问题代码,分析产生的原因。记录本次分析的全过程,活学活用,未来掌握更多的问题诊断工具。


 5554
5554


 被折叠的 条评论
为什么被折叠?
被折叠的 条评论
为什么被折叠?
 到【灌水乐园】发言


