


该文章是继windows配置之后继续的linux配置,所以不再进行其他表述,直接开始配置
相关文章
Grafana和Prometheus实现服务器监控——Windows
流程
这里进行一下说明,因为公司业务需要,配置情况是,设置了一台服务器上配置Grafana,其余Windows服务器和Linux服务器都只是配置了一个Prometheus和一个数据采集器
- [1]下载Prometheus安装包(Linux版本)
下载地址:https://prometheus.io/download/ - [2]上传prometheus-2.22.2.linux-amd64.tar.gz压缩包到linux系统
- [3]解压并安装软件
解压:
# tar xf prometheus-2.22.2.linux-amd64.tar.gz -C /usr/local/
重命名:
# mv /usr/local/prometheus-2.22.2.linux-amd64 /usr/local/prometheus
- [4]查看端口是否占用,如果没有占用就继续下一步,占用的话,改变prometheus启动端口即可
确认端口(9090)
# lsof -i:9090 或者 ss -naltp |grep 9090
注:提示 lsof: 未找到命令,使用yum来安装lsof,命令如下:
# yum install lsof
- [5]启动prometheus
默认端口启动方式:
# cd /usr/local/prometheus
# ./prometheus --config.file="/usr/local/prometheus/prometheus.yml" &
# 注:&符号为连接符,代表后台运行,不占用终端窗口
修改端口启动方式:
# cd /usr/local/prometheus
# ./prometheus --config.file="/usr/local/prometheus/prometheus.yml" --web.listen-address=:8091&
- [6]查看端口启动状态
# lsof -i:9090 或者 ss -naltp |grep 9090
- [7]查看prometheus界面:地址http://IP:9090/
在Status下的Targets中,如果显示的是UP说明监控正常,就可以进行下一步了


注:如果发现访问不了,那可能是防火墙端口未开放,开放一下防火墙端口即可
查看防火墙端口开放
# iptables -nL
编辑防火墙端口,新增开放端口9090
# vi /etc/sysconfig/iptables
重启防火墙
# service iptables restart
保存防火墙配置
# service iptables save
- [8]下载node_exporter数据采集器
下载地址:https://prometheus.io/download/#node_exporter - [9]上传node_exporter-0.18.1.linux-amd64.tar.gz压缩包到linux服务器
- [10]安装node_exporter
解压:
# tar xf node_exporter-0.18.1.linux-amd64.tar.gz -C /usr/local/
重命名:
# mv /usr/local/node_exporter-0.18.1.linux-amd64 /usr/local/node_exporter

端口9100占用情况
# lsof -i:9100 或者 ss -naltp |grep 9100

启动node_exporter
里面就一个启动命令node_exporter,可以直接使用此命令启动
# nohup /usr/local/node_exporter/node_exporter &
扩展:nohup命令:如果把启动node_exporter的终端关闭,那么进程也会随之关闭,nohup命令会解决这个问题

测试端口9100占用情况
# lsof -i:9100 或者 ss -naltp |grep 9100
通过浏览器访问 http://IP:9100/metrics 就可以查看到node_exporter在被监控端收集的监控信息,如下图:

- [10]将node_exporter数据采集到Prometheus,所以进行下面配置
编辑Prometheus配置文件
# vim /usr/local/prometheus/prometheus.yml
添加如下内容
- job_name: 'agent' #取一个job名称来代表被监控的机器
static_configs:
- targets: ['IP:9100'] #这里改成被监控机器的IP,后面端口接9100
改完后再重启Prometheus服务
# pkill prometheus #杀死Prometheus进程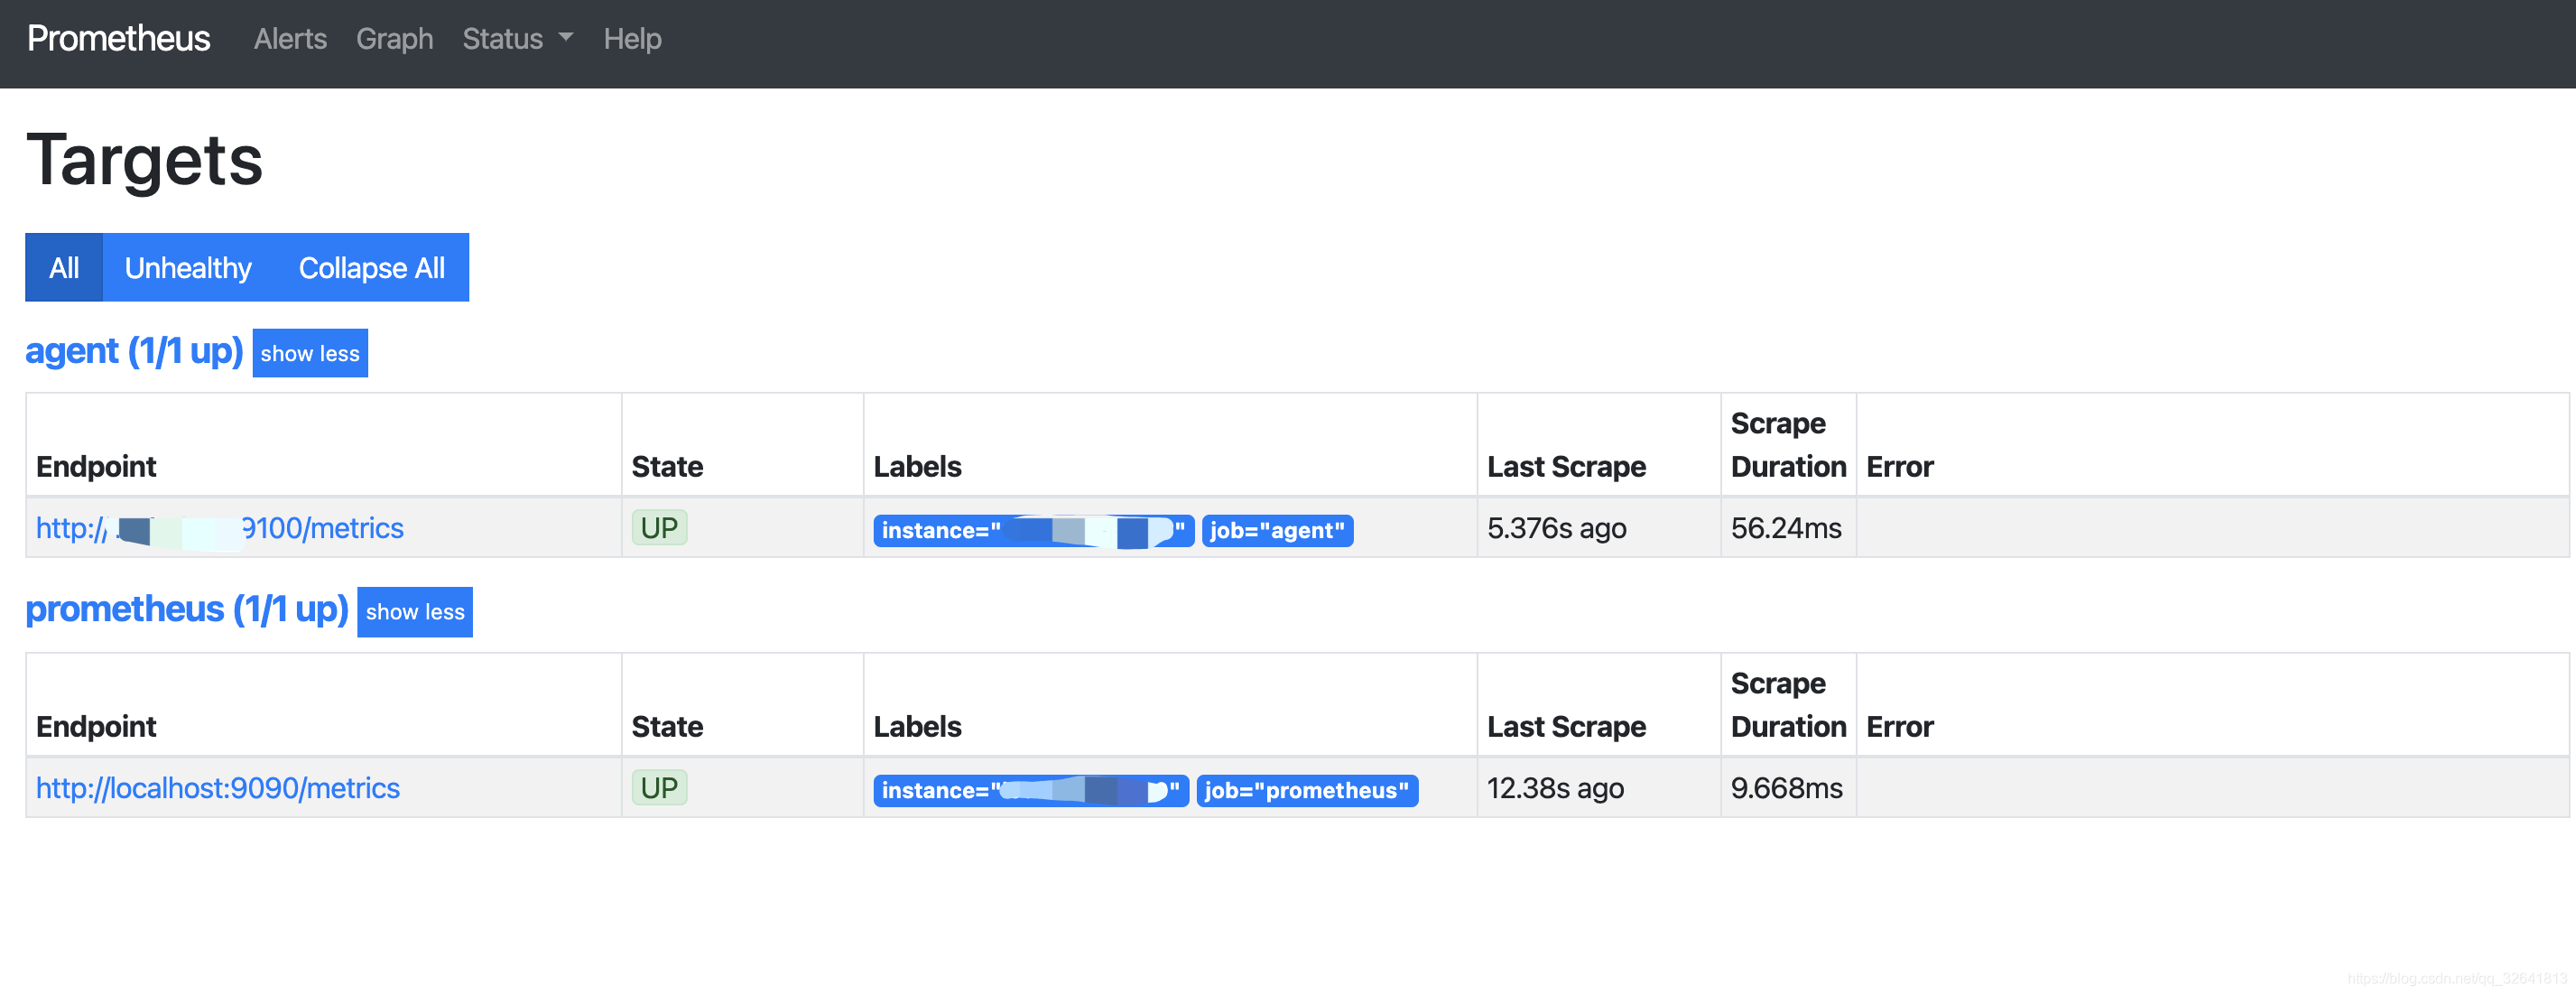
# lsof -i:9090 #确认端口没有进程占用
# cd /usr/local/prometheus
# ./prometheus --config.file="/usr/local/prometheus/prometheus.yml" & #重启prometheus服务
# lsof -i:9090 #确认端口,被占用说明重启成功
回到Prometheus的web管理页面(http://IP:9090/),点Status–>Targets可以看到多了一台监控目标

备注
linux启动Grafana
sudo /bin/systemctl daemon-reload
sudo /bin/systemctl enable grafana-server.service
sudo /bin/systemctl start grafana-server.service


 1327
1327

 被折叠的 条评论
为什么被折叠?
被折叠的 条评论
为什么被折叠?
 到【灌水乐园】发言


