


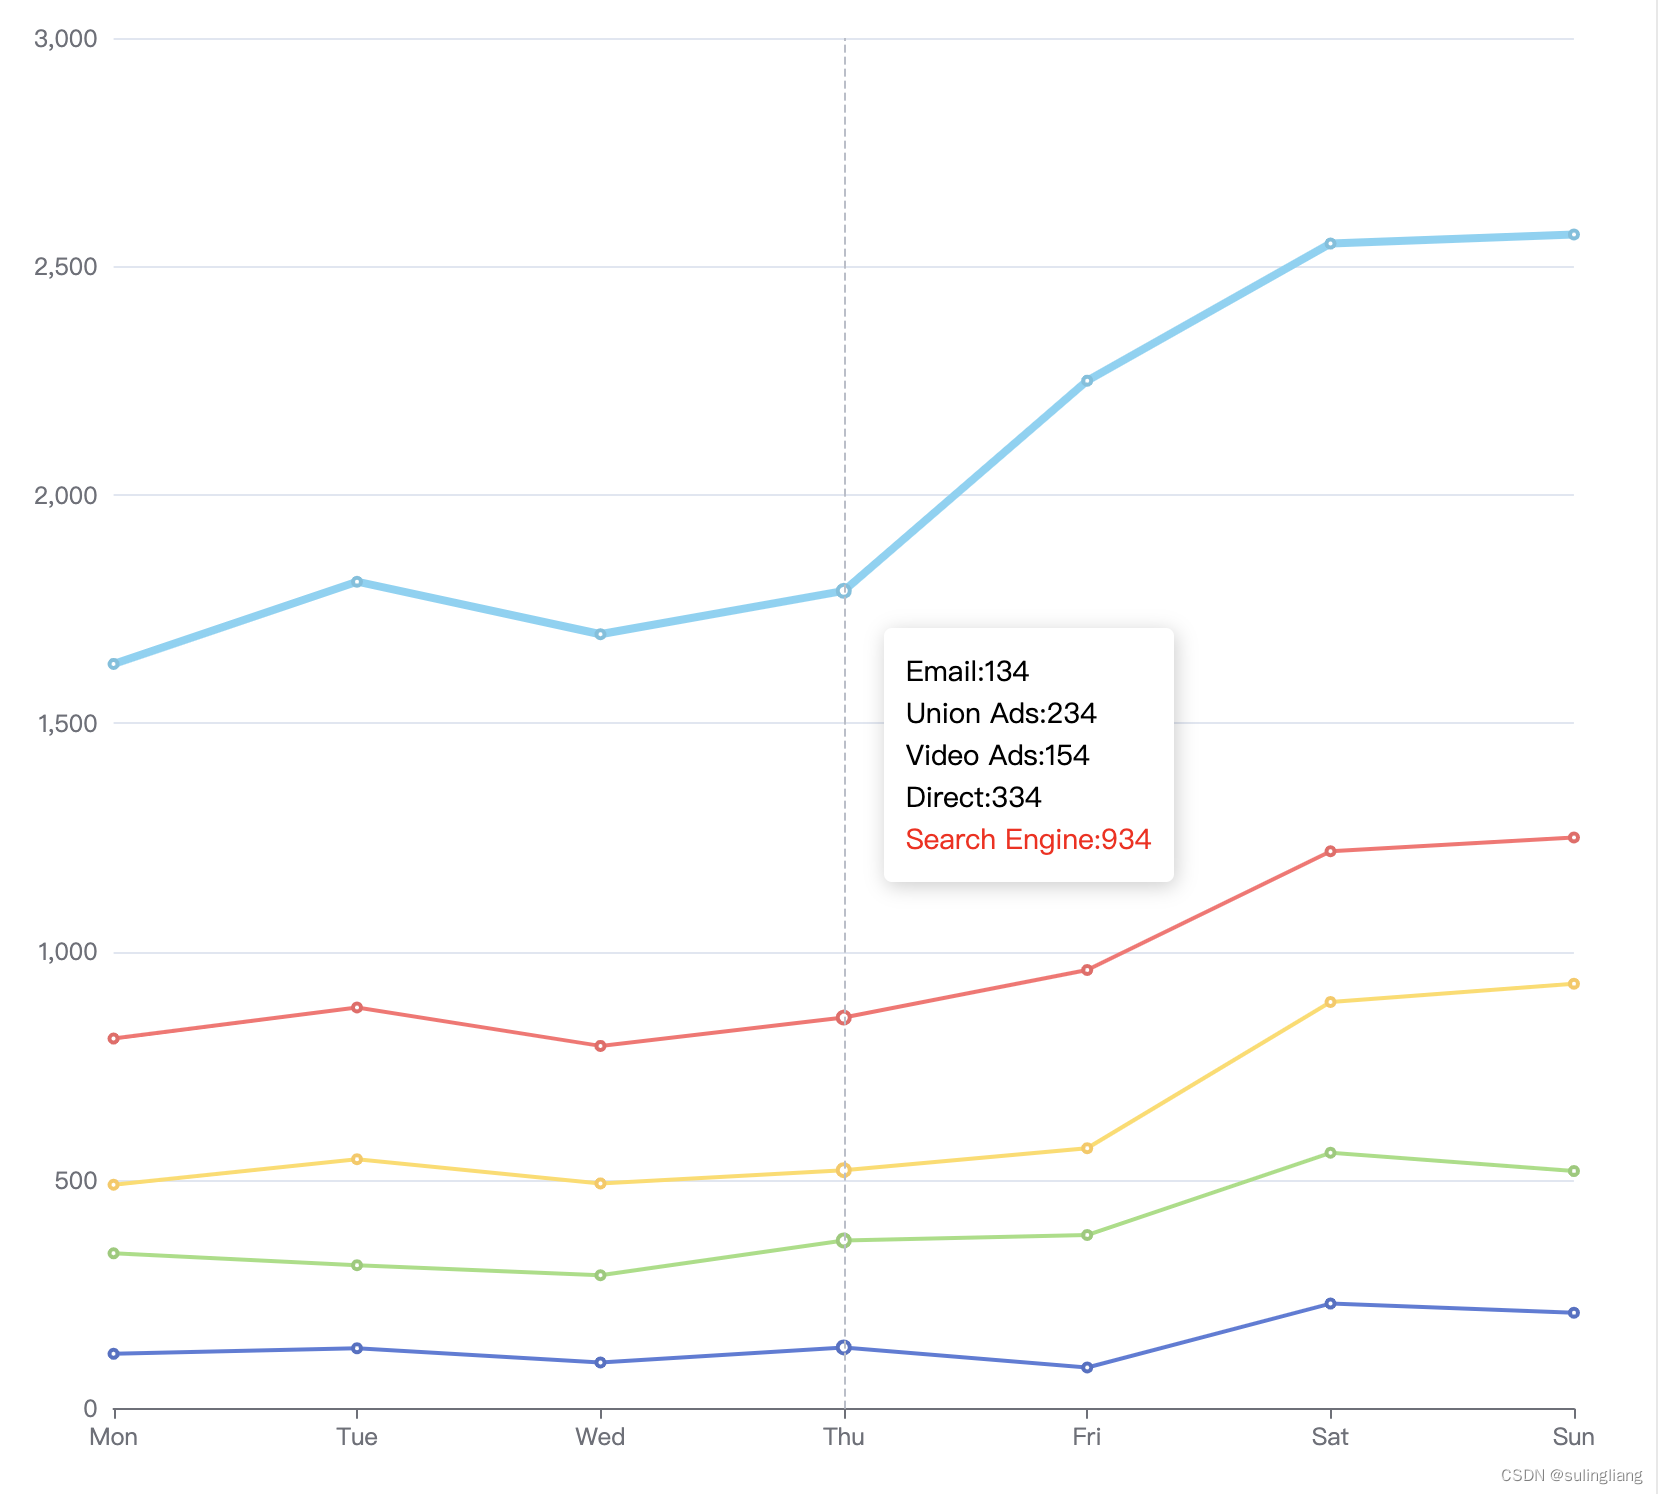
产品需求:如果折线图数据量过多时,会出现看不清楚的情况,所以希望能高亮当前点击的线,并在tooltip高亮当前点
tooltip配置:
tooltip: {
  trigger: 'axis',
  formatter: (params) => {
    let html = '';
    params.forEach(i => {
      const isHighlight = target.currentDataIndex === i.dataIndex && target.currentSeriesIndex === i.seriesIndex;
      html += `<span style="color:${isHighlight ? 'red' : '#000'}">${i.seriesName}:${i.value}<span><br/>`
    })
    return html;
  }
}
echarts监听事件:
const target = {};
myChart.on('mousemove', function (e) {//通过事件获取坐标点
  target.currentSeriesIndex=e.seriesIndex
  target.currentDataIndex=e.dataIndex
  myChart.setOption({
    series: {
      name: e.seriesName,
      lineStyle: {
        width: 4
      }
    }
  })
})
myChart.on('mouseout',function(e){
  target.currentSeriesIndex=0
  target.currentDataIndex=0
  myChart.setOption({
    series: {
      name: e.seriesName,
      lineStyle: {
        width: 2
      }
    }
  })
})
效果图:


 4443
4443

 被折叠的 条评论
为什么被折叠?
被折叠的 条评论
为什么被折叠?
 到【灌水乐园】发言


