


Bokeh 创建子图与布局
https://docs.bokeh.org/en/latest/docs/user_guide/layout.html
Bokeh包括几个用于绘图和小部件的布局选项。通过这些,您可以排列多个组件以创建交互式仪表板和数据应用程序。
布局函数允许您构建绘图和小部件的网格。在一个布局中,可以有任意多个打印行、列或网格。Bokeh布局还允许许多大小选择或模式。这些模式允许绘图和小部件调整大小以适应浏览器窗口。
Basic Layout
Column Layout
要垂直显示绘图或小部件,请使用column() 函数。
from bokeh.io import output_notebook, show
from bokeh.layouts import column
from bokeh.plotting import figure

output_notebook()

x = list(range(11))
y0 = x
y1 = [10 - i for i in x]
y2 = [abs(i - 5) for i in x]

# create three plots
s1 = figure(width=250, height=250, background_fill_color="#fafafa")
s1.circle(x, y0, size=12, color="#53777a", alpha=0.8)

s2 = figure(width=250, height=250, background_fill_color="#fafafa")
s2.triangle(x, y1, size=12, color="#c02942", alpha=0.8)

s3 = figure(width=250, height=250, background_fill_color="#fafafa")
s3.square(x, y2, size=12, color="#d95b43", alpha=0.8)

# put the results in a column and show
show(column(s1, s2, s3))

Row Layout
要水平显示绘图或小部件,请使用 row() 函数。
from bokeh.io import output_notebook, show
from bokeh.layouts import row
from bokeh.plotting import figure

output_notebook()

x = list(range(11))
y0 = x
y1 = [10 - i for i in x]
y2 = [abs(i - 5) for i in x]

# create three plots
s1 = figure(width=250, height=250, background_fill_color="#fafafa")
s1.circle(x, y0, size=12, color="#53777a", alpha=0.8)

s2 = figure(width=250, height=250, background_fill_color="#fafafa")
s2.triangle(x, y1, size=12, color="#c02942", alpha=0.8)

s3 = figure(width=250, height=250, background_fill_color="#fafafa")
s3.square(x, y2, size=12, color="#d95b43", alpha=0.8)

# put the results in a row and show
show(row(s1, s2, s3))

Grid Layout for plots
使用gridplot() 函数在网格中排列 Bokeh 图。此功能还可以将所有打印工具合并到单个工具栏中。网格中的每个绘图都具有相同的活动工具。
通过将 None 而不是 plot 对象传递给网格单元,可以将网格单元留空。
from bokeh.io import output_notebook, show
from bokeh.layouts import gridplot
from bokeh.plotting import figure

output_notebook()

x = list(range(11))
y0 = x
y1 = [10 - i for i in x]
y2 = [abs(i - 5) for i in x]

# create three plots
s1 = figure(background_fill_color="#fafafa")
s1.circle(x, y0, size=12, alpha=0.8, color="#53777a")

s2 = figure(background_fill_color="#fafafa")
s2.triangle(x, y1, size=12, alpha=0.8, color="#c02942")

s3 = figure(background_fill_color="#fafafa")
s3.square(x, y2, size=12, alpha=0.8, color="#d95b43")

# make a grid
grid = gridplot([[s1, s2], [None, s3]], plot_width=250, plot_height=250)

show(grid)

为方便起见,您还可以传递一个绘图列表,并指定网格中所需的列数。例如:
gridplot([s1, s2, s3], ncols=2)
还可以传入 plot_width 和 plot_height 。这些尺寸将应用于所有绘图。
默认情况下,gridplot() 将所有子打印工具合并到一个父网格工具栏中。若要禁用此行为,请将 merge_tools 设置为False。
from bokeh.io import output_notebook, show
from bokeh.layouts import gridplot
from bokeh.plotting import figure

output_notebook()

x = list(range(11))
y0 = x
y1 = [10 - i for i in x]
y2 = [abs(i - 5) for i in x]

# create three plots
s1 = figure(background_fill_color="#fafafa")
s1.circle(x, y0, size=12, alpha=0.8, color="#53777a")

s2 = figure(background_fill_color="#fafafa")
s2.triangle(x, y1, size=12, alpha=0.8, color="#c02942")

s3 = figure(background_fill_color="#fafafa")
s3.square(x, y2, size=12, alpha=0.8, color="#d95b43")

# make a grid
grid = gridplot([s1, s2, s3], ncols=2, plot_height=250, plot_width=250)

show(grid)

General grid Layout
可以使用layout()函数将绘图和小部件排列到网格中。这会自动生成适当的row()和columns()布局,从而节省时间。请尝试以下代码以了解此函数的工作原理。
sliders = column(amp, freq, phase, offset)

layout([
    [bollinger],
    [sliders, plot],
    [p1, p2, p3],
])
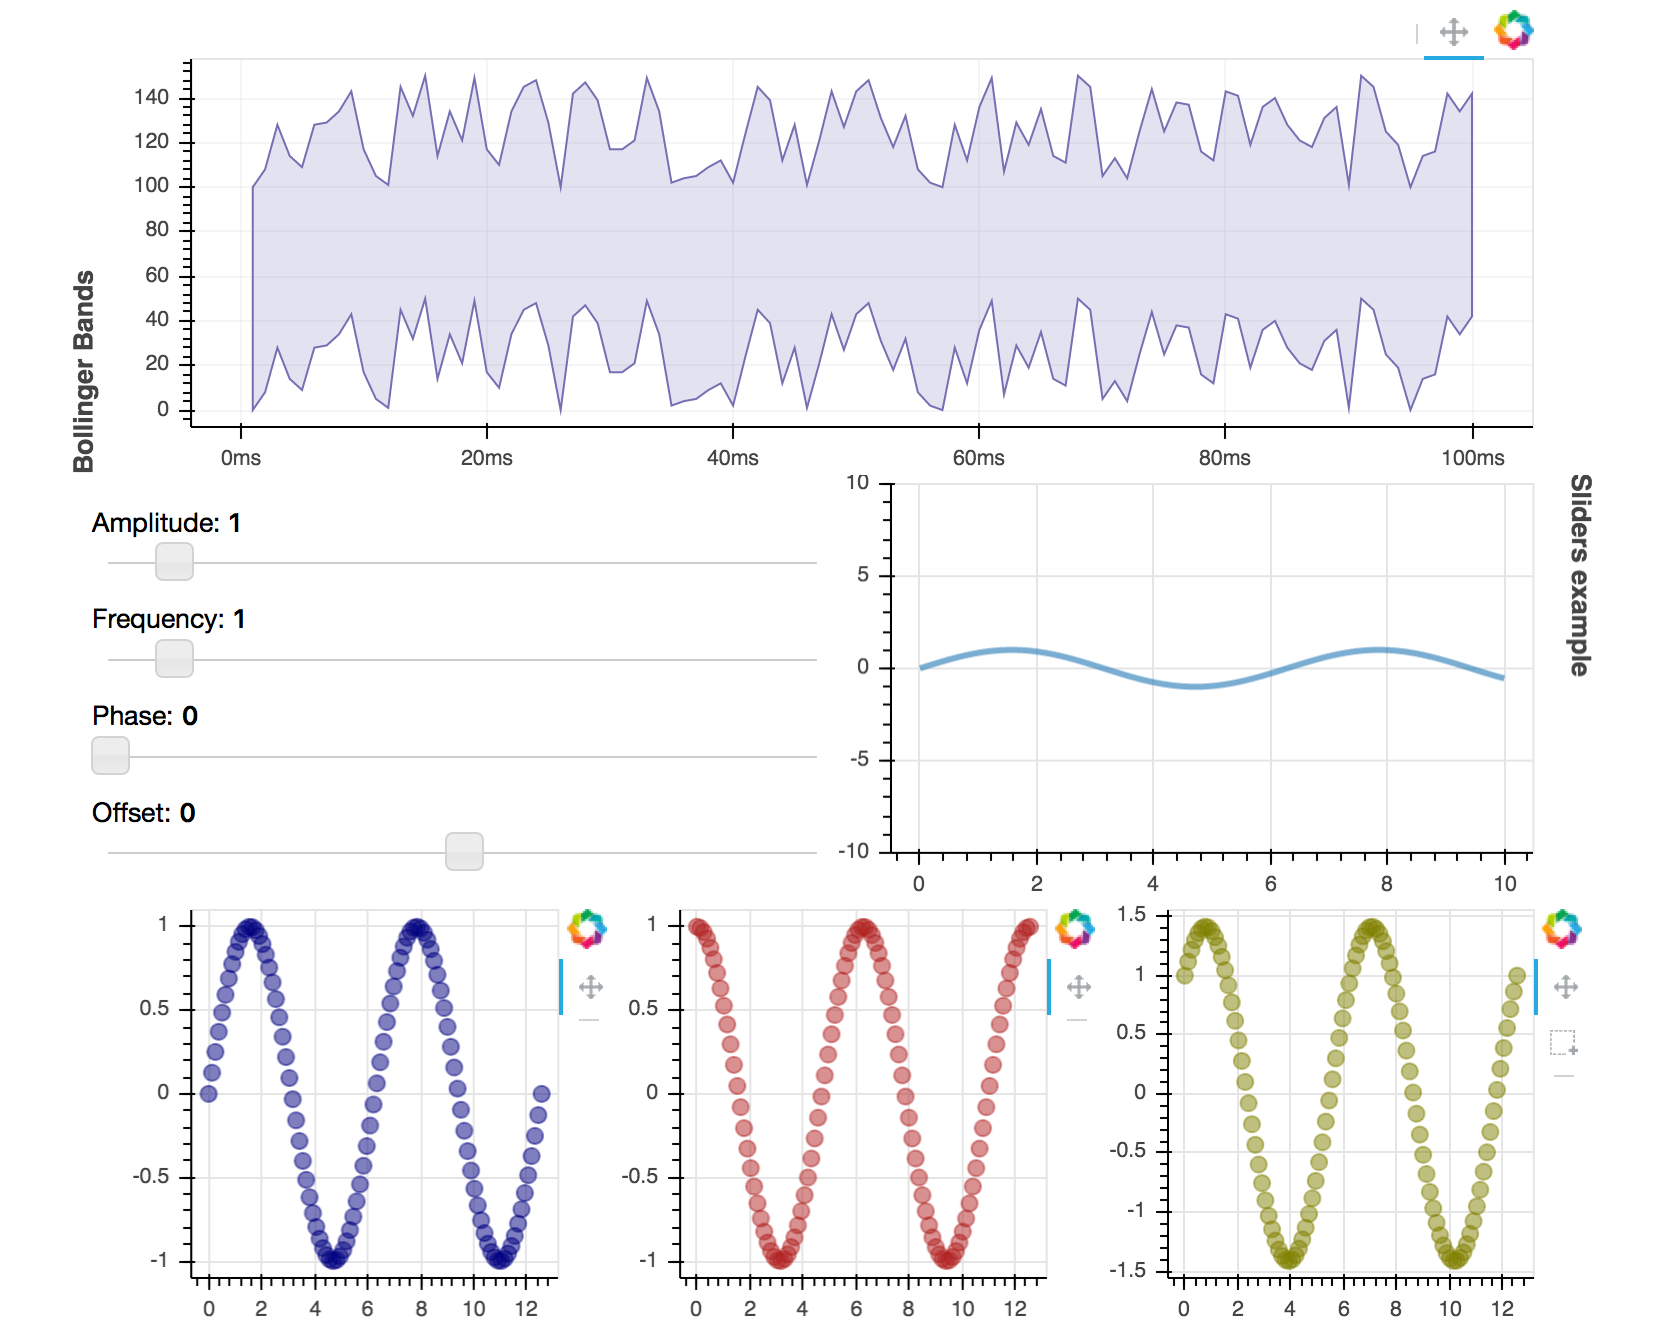
For complete code see examples/howto/layouts/dashboard.py.


 4244
4244


 被折叠的 条评论
为什么被折叠?
被折叠的 条评论
为什么被折叠?
 到【灌水乐园】发言


