


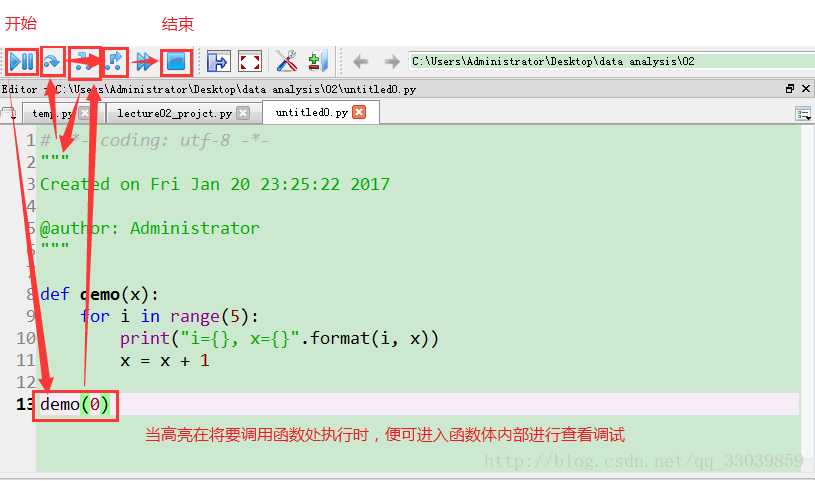
- 编辑器环境示意图
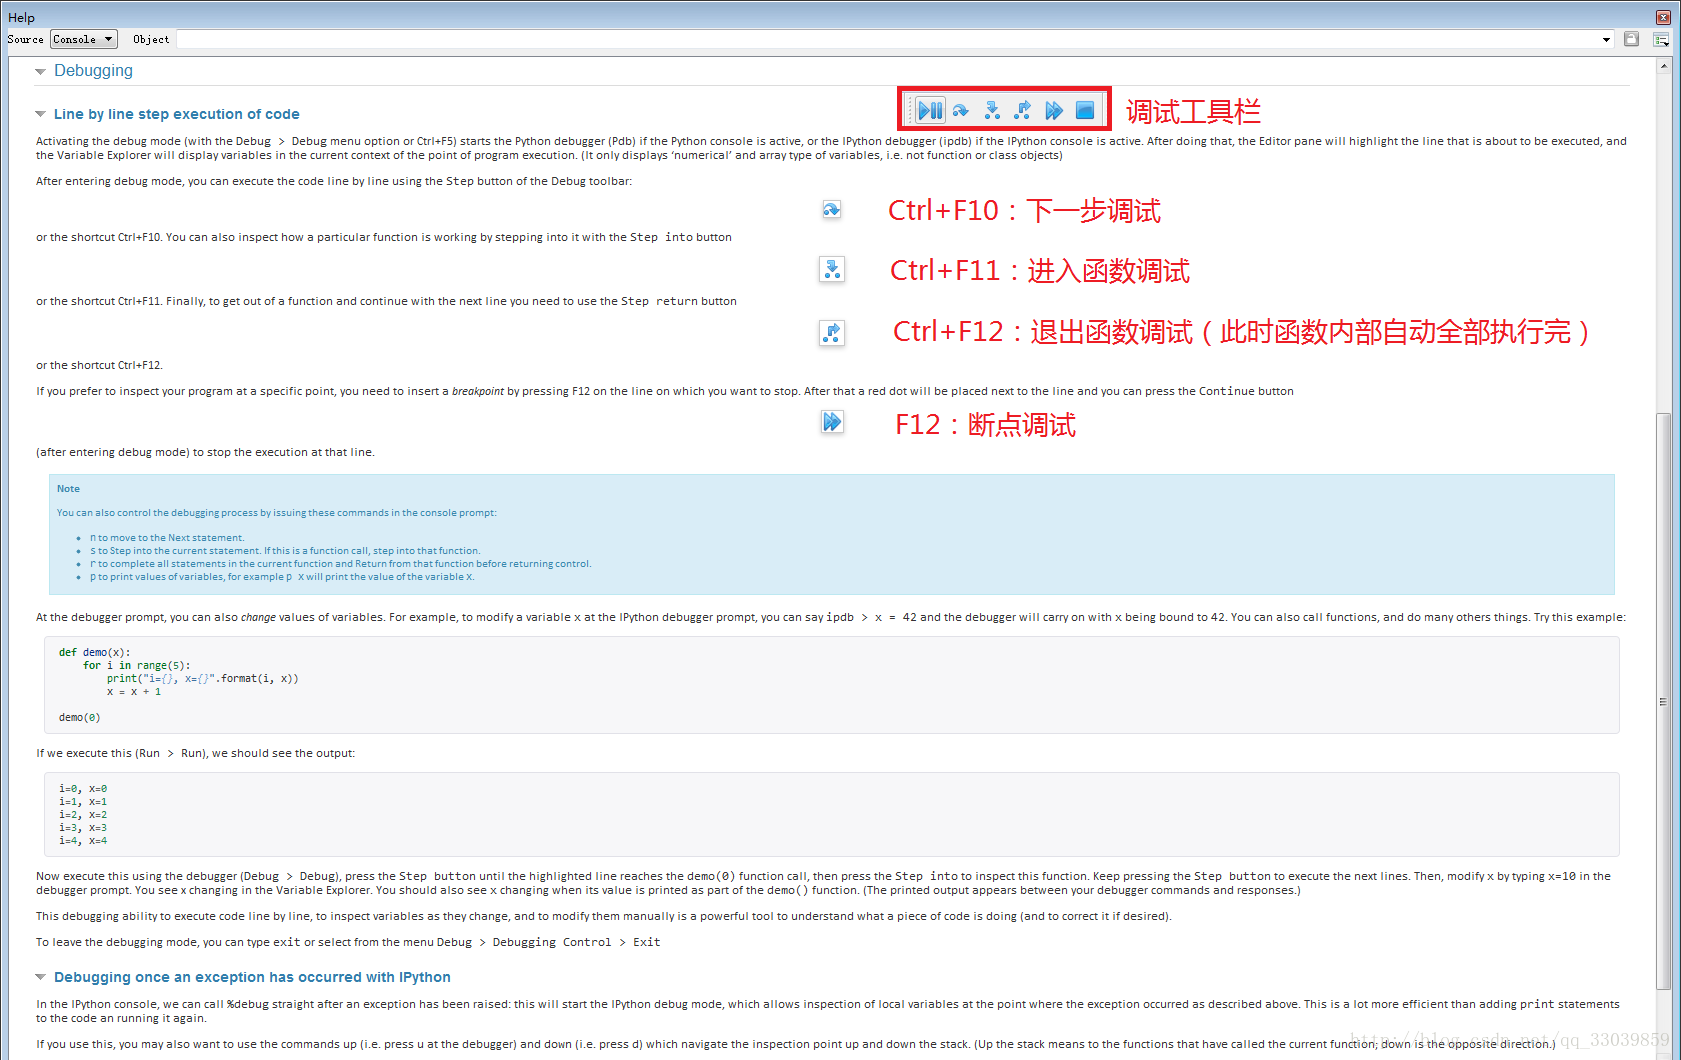
- 调试快捷键(具体可查看Spyder的tutorial,如下图)
注意:双击(或 F12)代码段左侧序号处可设置或取消断点,
- 实例代码段及说明
def demo(x):
    for i in range(5):
        print("i={}, x={}".format(i, x))
        x = x + 1
demo(0)
例子说明(大意就是:debug模式下,函数调用被高亮时Ctrl+F11可进入函数内查看并debug修改观测)
Now execute this using the debugger (Debug > Debug), press the Step button until the highlighted line reaches the demo(0) function call, then press the Step into to inspect this function. Keep pressing the Step button to execute the next lines. Then, modify x by typing x=10 in the debugger prompt. You see x changing in the Variable Explorer. You should also see x changing when its value is printed as part of the demo() function. (The printed output appears between your debugger commands and responses.)This debugging ability to execute code line by line, to inspect variables as they change, and to modify them manually is a powerful tool to understand what a piece of code is doing (and to correct it if desired).
To leave the debugging mode, you can type exit or select from the menu Debug > Debugging Control > Exit
- Spyder Documentation Online:
http://pythonhosted.org/spyder/index.html
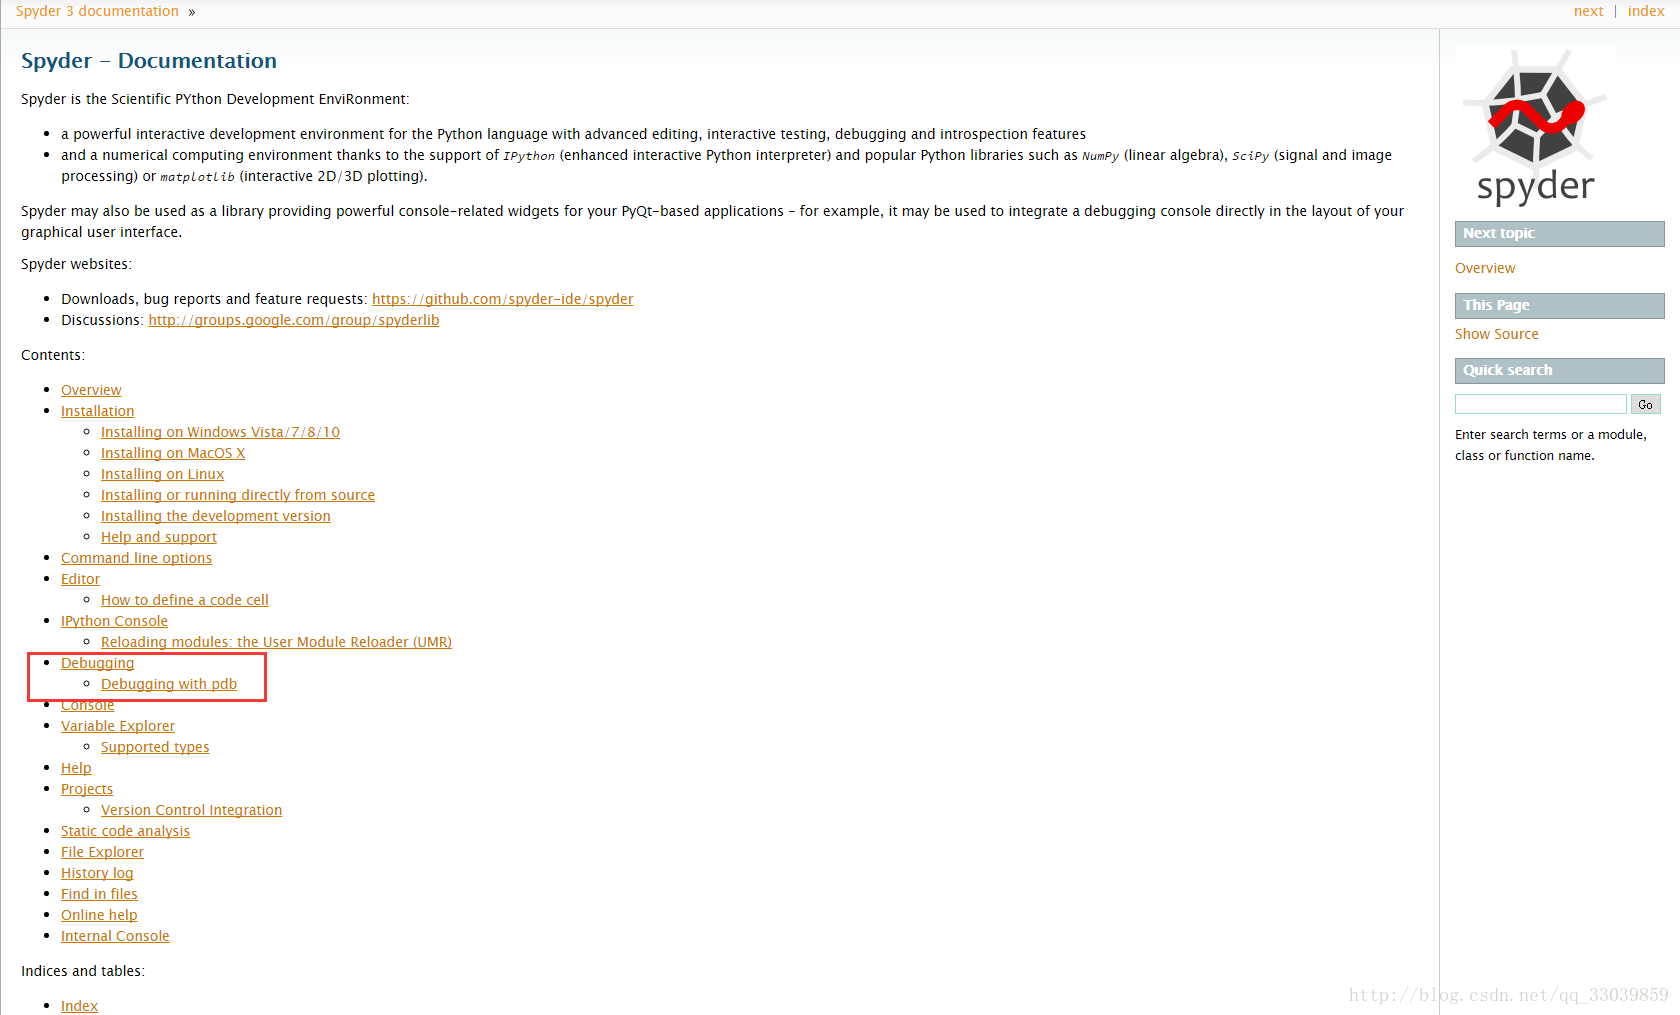
- Debugging
##Debugging##
Debugging in Spyder is supported thanks to the following Python modules:

pdb: the Python debugger, which is included in Python standard library.
winpdb: a graphical frontend to pdb, which is an external package (in the Editor, press F7 to run winpdb on the currently edited script).

##Debugging with pdb##
The Python debugger is partly integrated in Spyder:

Breakpoints may be defined in the Editor.
Simple breakpoints can be set from the Run menu, by keyboard shortcut (F12 by default), or by double-click to the left of line numbers in the Editor.
Conditional breakpoints can also be set from the Run menu, by keyboard shortcut (Shift+F12 by default), or by Shift+double-click to the left of line numbers in the Editor.
The current frame (debugging step) is highlighted in the Editor.
At each breakpoint, globals may be accessed through the Variable Explorer.
For a simple, yet quite complete introduction to pdb, you may read this:
- Command 窗口中输出
run(非本文重点,可忽略,但command窗口可通过命令的形式进行debug调试)
run
%run: Run the named file inside IPython as a program.
Usage::
%run [-n -i -e -G]
[( -t [-N] | -d [-b] | -p [profile options] )]
( -m mod | file ) [args]Parameters after the filename are passed as command-line arguments to
the program (put in sys.argv). Then, control returns to IPython’s
prompt.This is similar to running at a system prompt
python file args,
but with the advantage of giving you IPython’s tracebacks, and of
loading all variables into your interactive namespace for further use
(unless -p is used, see below).The file is executed in a namespace initially consisting only of
__name__=='__main__'and sys.argv constructed as indicated. It
thus sees its environment as if it were being run as a stand-alone
program (except for sharing global objects such as previously imported
modules). But after execution, the IPython interactive namespace gets
updated with all variables defined in the program (except for name
and sys.argv). This allows for very convenient loading of code for
interactive work, while giving each program a ‘clean sheet’ to run in.Arguments are expanded using shell-like glob match. Patterns ‘*’,
‘?’, ‘[seq]’ and ‘[!seq]’ can be used. Additionally, tilde ‘~’ will
be expanded into user’s home directory. Unlike real shells, quotation
does not suppress expansions. Use
two back slashes (e.g.\\*) to suppress expansions. To completely disable these expansions, you can use -G flag.Options:
-n name is NOT set to ‘main‘, but to the running file’s name without extension (as python does under import). This allows running
scripts and reloading the definitions in them without calling code
protected by anif __name__ == "__main__"clause.-i run the file in IPython’s namespace instead of an empty one. This is useful if you are experimenting with code written in a text editor
which depends on variables defined interactively.-e ignore sys.exit() calls or SystemExit exceptions in the script being run. This is particularly useful if IPython is being used to
run unittests, which always exit with a sys.exit() call. In such
cases you are interested in the output of the test results, not in
seeing a traceback of the unittest module.-t print timing information at the end of the run. IPython will give you an estimated CPU time consumption for your script, which
under Unix uses the resource module to avoid the wraparound problems
of time.clock(). Under Unix, an estimate of time spent on system
tasks is also given (for Windows platforms this is reported as 0.0).If -t is given, an additional
-N<N>option can be given, where
must be an integer indicating how many times you want the script to
run. The final timing report will include total and per run results.For example (testing the script uniq_stable.py)::
run -t uniq_stable
IPython CPU timings (estimated):
  User  :    0.19597 s.
  System:        0.0 s.
run -t -N5 uniq_stable
IPython CPU timings (estimated):
Total runs performed: 5
  Times :      Total       Per run
  User  :   0.910862 s,  0.1821724 s.
  System:        0.0 s,        0.0 s.
-d run your program under the control of pdb, the Python debugger. This allows you to execute your program step by step, watch variables,
etc. Internally, what IPython does is similar to calling::pdb.run('execfile("YOURFILENAME")')with a breakpoint set on line 1 of your file. You can change the
line number for this automatic breakpoint to be by using the -bN
option (where N must be an integer). For example::%run -d -b40 myscriptwill set the first breakpoint at line 40 in myscript.py. Note that
the first breakpoint must be set on a line which actually does
something (not a comment or docstring) for it to stop execution.Or you can specify a breakpoint in a different file::
%run -d -b myotherfile.py:20 myscriptWhen the pdb debugger starts, you will see a (Pdb) prompt. You must
first enter ‘c’ (without quotes) to start execution up to the first
breakpoint.Entering ‘help’ gives information about the use of the debugger.
You can easily see pdb’s full documentation with “import
pdb;pdb.help()” at a prompt.-p run program under the control of the Python profiler module (which prints a detailed report of execution times, function calls,
etc).You can pass other options after -p which affect the behavior of the
profiler itself. See the docs for %prun for details.In this mode, the program’s variables do NOT propagate back to the
IPython interactive namespace (because they remain in the namespace
where the profiler executes them).Internally this triggers a call to %prun, see its documentation for
details on the options available specifically for profiling.There is one special usage for which the text above doesn’t apply: if
the filename ends with .ipy[nb], the file is run as ipython script,
just as if the commands were written on IPython prompt.-m specify module name to load instead of script path. Similar to the -m option for the python interpreter. Use this option last if you
want to combine with other %run options. Unlike the python interpreter
only source modules are allowed no .pyc or .pyo files. For example::%run -m examplewill run the example module.
-G disable shell-like glob expansion of arguments. C:\Program Files\Anaconda2\lib\site-packages\IPython\core\magics\execution.py:614:
UserWarning: you must provide at least a filename. warn(‘you must
provide at least a filename.’)


 1158
1158

 被折叠的 条评论
为什么被折叠?
被折叠的 条评论
为什么被折叠?
 到【灌水乐园】发言


