


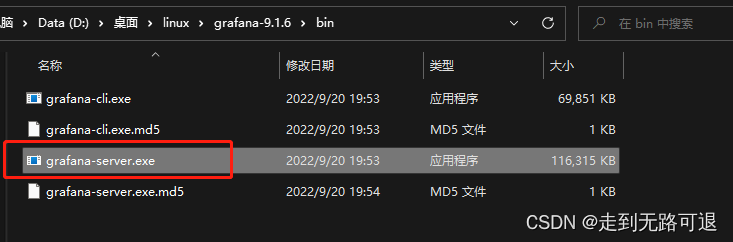
1.grafana
去官网下载windos版本,这里使用的是grafana-enterprise-9.1.6.windows-amd64.zip
下载解压直接启动
http://localhost:3000/
访问操作界面,默认账户密码admin,admin,第一次登录需要修改密码
2.loki
github下面页面
https://github.com/grafana/loki/releases
我下载的是这两个版本
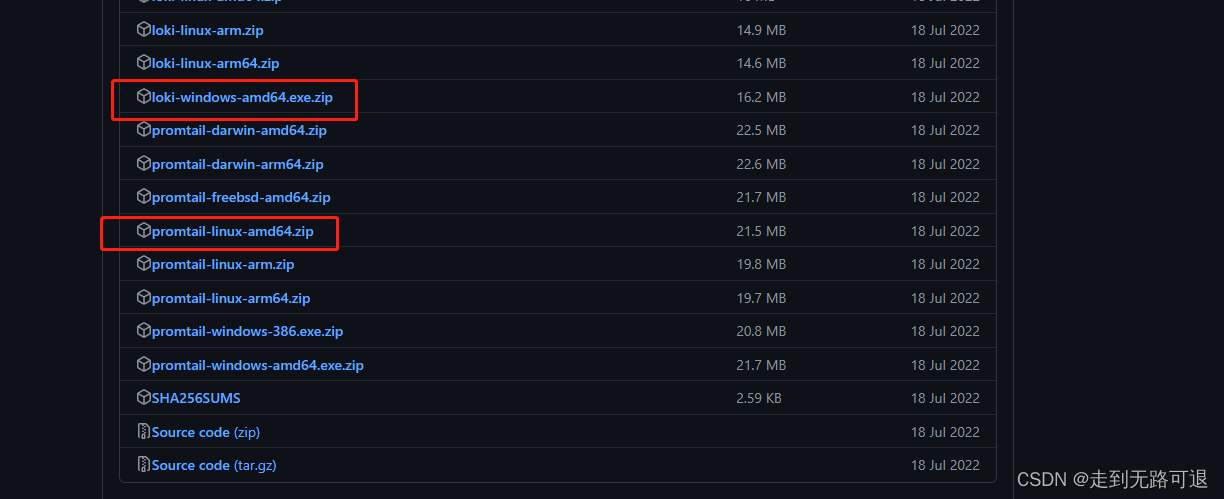
loki在windos上运行,promtail在linux上运行
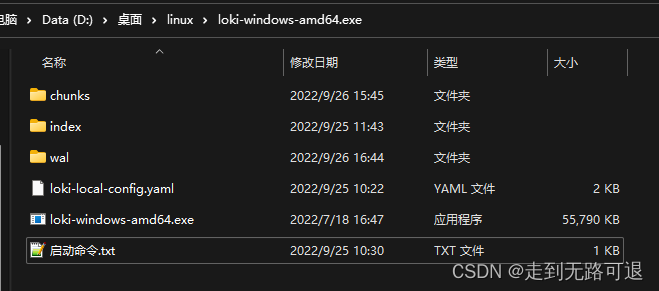
解压loki
在里面添加配置文件 loki-local-config.yaml
auth_enabled: false

server:
  http_listen_port: 3100
ingester: # 配置ingester的生命周期如何运行,以及它将在哪里注册以进行发现
  lifecycler:
    address: 127.0.0.1 #部署loki服务器的ip
    ring: # ring用于发现并连接到Ingesters
      kvstore:
        store: inmemory # 用于连接后端存储,支持的值有:consul etcd inmemory
      replication_factor: 1 # 写入和读取的指数
    final_sleep: 0s
  chunk_idle_period: 5m # 空闲时间
  chunk_retain_period: 30s # 保留时间

schema_config:
  configs:
  - from: 2021-07-01
    store: boltdb
    object_store: filesystem
    schema: v11
    index:
      prefix: index_
      period: 168h   #每张表的时间范围7天

storage_config:
  boltdb:
    directory: D:\desktop\linux\loki-windows-amd64.exe\index   #索引文件存储地址
  filesystem:
    directory: D:\desktop\linux\loki-windows-amd64.exe\chunks  #块存储地址

limits_config:
  enforce_metric_name: false
  reject_old_samples: true
  reject_old_samples_max_age: 168h
chunk_store_config:
# 最大可查询历史日期 28天,这个时间必须是schema_config中的period的倍数,否则报错。只适用于即时日志
  max_look_back_period: 672h
# 表的保留期28天
table_manager:
  retention_deletes_enabled: true
  retention_period: 672h
运行启动命令启动
.\loki-windows-amd64.exe --config.file=loki-local-config.yaml
如图
3.promtail
把上一步下载的promtail移动到linux目录下
配置文件官网
https://grafana.com/docs/loki/latest/clients/promtail/configuration/
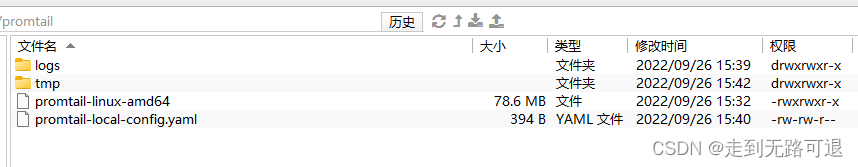
新增配置文件 promtail-local-config.yaml
server:
  http_listen_port: 9080
  grpc_listen_port: 0

positions:
  filename: /home/sdcp/sdap/sccmcc/promtail/tmp/positions.yaml

clients:
  - url: http://10.200.1.58:3100/loki/api/v1/push

scrape_configs:
- job_name: system
  static_configs:
  - targets:
      - localhost
    labels:
      job: sccmcc_dc_log
      __path__: /home/sdcp/sdap/sccmcc/DCStudio_2.3.0/logs/*.log
启动命令
.\promtail-linux-amd64 --config.file=promtail-local-config.yaml
命令都是前台启动的,可以做成后台启动,开机自启动
后台启动
nohup ./promtail-linux-amd64 -config.file=promtail-local-config.yaml > promtail.log 2>&1 &
如果检测多个服务下的多个日志文件
job_name 不能是一样的
如下所示
server:
  http_listen_port: 9080
  grpc_listen_port: 0

positions:
  filename: /home/sdcp/sdap/sccmcc/promtail/tmp/positions.yaml

clients:
  - url: http://192.168.30.43:3100/loki/api/v1/push


scrape_configs:
 - job_name: web_sccmcc_dc
   pipeline_stages:
   static_configs:
   - targets:
      - localhost
     labels:
      job: sccmcc_dc_log
      host: 192.168.30.38
      __path__: /home/sdcp/sdap/sccmcc/DCStudio_2.3.0/logs/*.log

 - job_name: web_sccmcc_service
   pipeline_stages:
   static_configs:
   - targets:
      - localhost
     labels:
      job: sccmcc_service_log
      host: 192.168.30.38
      __path__: /home/sdcp/sdap/sccmcc/sdapweb/service/sdap-service.log

 - job_name: web_nginx
   pipeline_stages:
   static_configs:
   - targets:
      - localhost
     labels:
      job: nginx_log
      host: 192.168.30.38
      __path__: /home/sdcp/opensoft/nginx/logs/*.log
4. 配置 grafana
访问 http://localhost:3000/
新增数据源
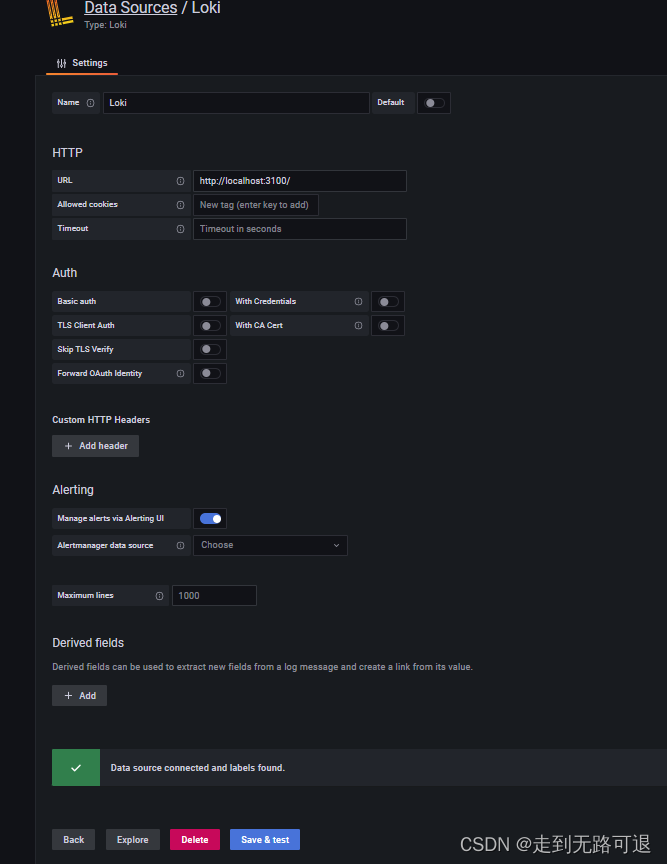
请等上面几步配置完成后在新增,否则会报错。
新增成功后打开页面
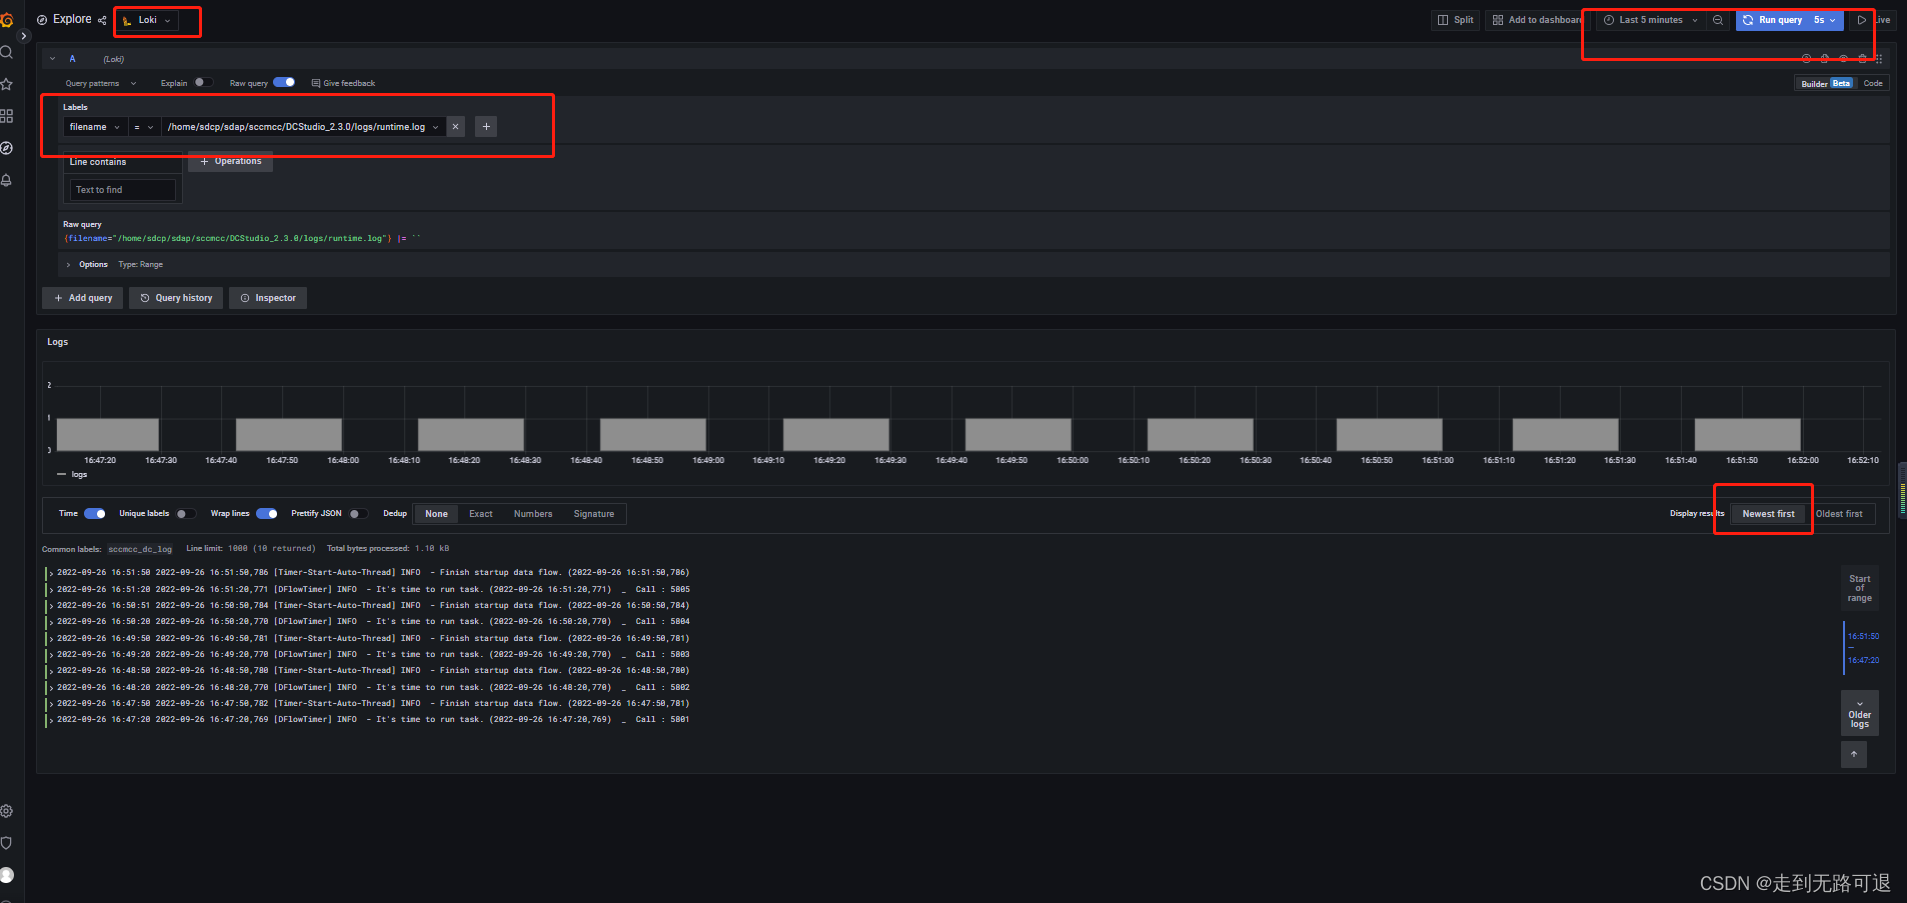
成功显示日志


 3889
3889


 被折叠的 条评论
为什么被折叠?
被折叠的 条评论
为什么被折叠?
 到【灌水乐园】发言


