


因写大论文需要,在知网上别人的论文中扣下来清晰度不够,其他网页上截屏下来可能包含水印,同时也比较难找全。因此参考CSDN博客资料,自己画出来用于论文书写。
import math
import numpy as np
import matplotlib.pyplot as plt
# set x's range
x = np.arange(-10, 10, 0.1)
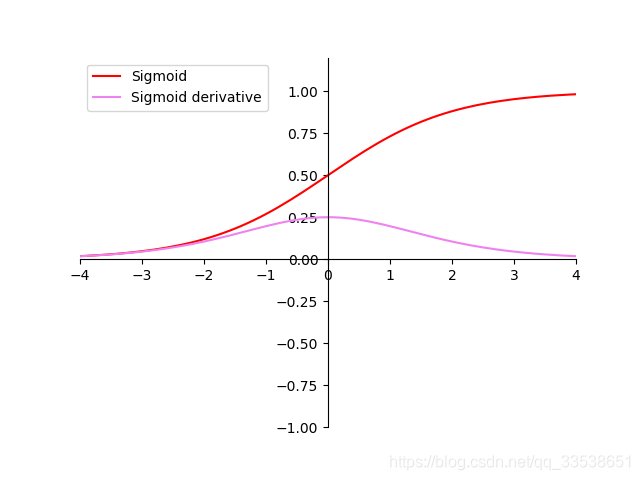
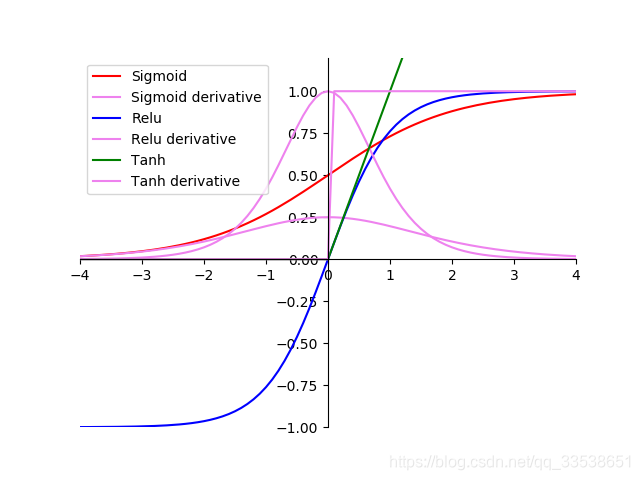
y1 = 1 / (1 + math.e ** (-x)) # sigmoid
# y11=math.e**(-x)/((1+math.e**(-x))**2)
y11 = 1 / (2 + math.e ** (-x)+ math.e ** (x)) # sigmoid的导数
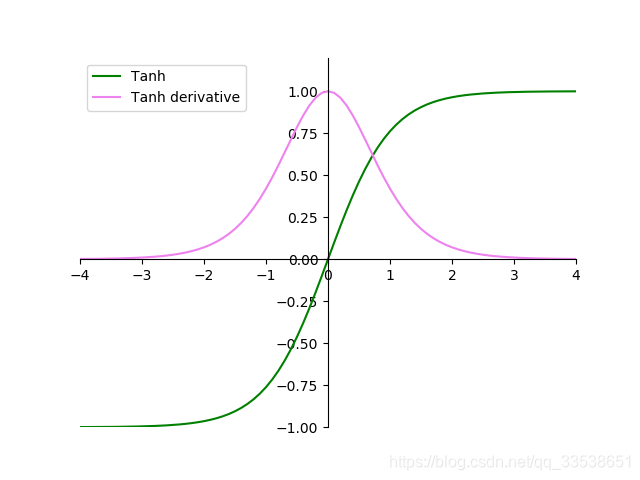
y2 = (math.e ** (x) - math.e ** (-x)) / (math.e ** (x) + math.e ** (-x)) # tanh
y22 = 1-y2*y2 # tanh函数的导数
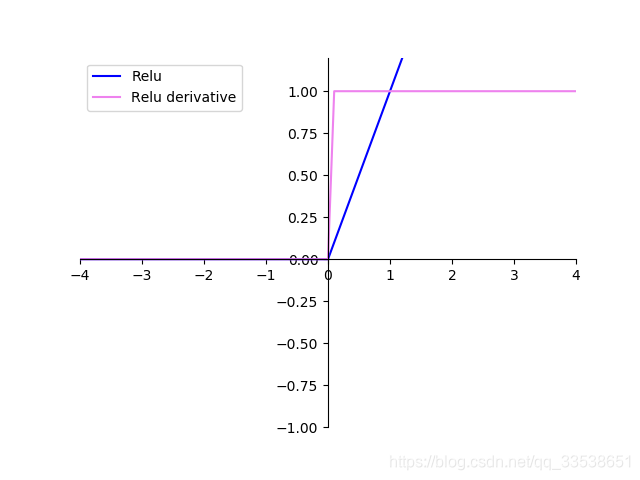
y3 = np.where(x < 0, 0, x) # relu
y33 = np.where(x < 0, 0, 1) # ReLU函数导数
plt.xlim(-4, 4)
plt.ylim(-1, 1.2)
ax = plt.gca()
ax.spines['right'].set_color('none')
ax.spines['top'].set_color('none')
ax.xaxis.set_ticks_position('bottom')
ax.yaxis.set_ticks_position('left')
ax.spines['bottom'].set_position(('data', 0))
ax.spines['left'].set_position(('data', 0))
# Draw pic
plt.plot(x, y1, label='Sigmoid', linestyle="-", color="red")
plt.plot(x, y11, label='Sigmoid derivative', linestyle="-", color="violet")
plt.plot(x, y2, label='Relu', linestyle="-", color="blue")
plt.plot(x, y22, label='Relu derivative', linestyle="-", color="violet")
plt.plot(x, y3, label='Tanh', linestyle="-", color="green")
plt.plot(x, y33, label='Tanh derivative', linestyle="-", color="violet")
# Title
plt.legend(['Sigmoid', 'Tanh', 'Relu'])
plt.legend(['Sigmoid', 'Sigmoid derivative']) # y1 y11
plt.legend(['Relu', 'Relu derivative']) # y2 y22
plt.legend(['Tanh', 'Tanh derivative']) # y3 y33
plt.legend(['Sigmoid', 'Sigmoid derivative', 'Relu', 'Relu derivative', 'Tanh', 'Tanh derivative']) # y3 y33
# plt.legend(loc='upper left') # 将图例放在左上角
# save pic
# plt.savefig('plot_test.png', dpi=100)
plt.savefig(r"./Desktop/to/SRL_result")
# show it!!
# plt.show()
根据个人需要,可以通过对代码的注释达到自己的要求。
贴图:
参考博客:
1.python绘制同时包含Sigmoid、Tanh和Relu函数的图像
https://blog.csdn.net/four_sea/article/details/89734991
2.激活函数-Sigmoid, Tanh及ReLU
https://blog.csdn.net/lwc5411117/article/details/83620184


 被折叠的 条评论
为什么被折叠?
被折叠的 条评论
为什么被折叠?
 到【灌水乐园】发言


