


让我们来分析一下这个评价指标:
轮廓系数分析
- 对于第 i i i个对象,计算它到所属簇中所有其他元素的平均距离,记作 a i a_i ai(体现凝聚度)
- 对于第 i i i 个对象和不包含该对象的任意簇,计算该对象到给定簇中所有对象的平均距离,记 b i b_i bi (体现分离度)
- 第 i 个对象的轮廓系数为 s i = ( b i − a i ) m a x ( a i , b i ) s_i = \frac{(bi-ai)}{max(ai, bi)} si=max(ai,bi)(bi−ai)
对应于sklearn中,这个包的调用是在sklearn.metrics.silhouette_score。我们来看看,利用这个指标进行评估,会得到怎样的结果。
实战结果
import pandas as pd
import matplotlib.pyplot as plt
from sklearn.metrics import silhouette_score

import os
import sys
import pandas as pd
import numpy as np
from tqdm import tqdm, trange
from matplotlib import pyplot as plt
import seaborn as sns
import json
import pathlib
from pathlib import Path
首先,来学习一个新知识,轮廓系数
from sklearn.cluster import KMeans

from sklearn.metrics import silhouette_score
先创造一些toy data
x1 = np.array([1, 2, 3, 1, 5, 6, 5, 5, 6, 7, 8, 9, 7, 9])
x2 = np.array([1, 3, 2, 2, 8, 6, 7, 6, 7, 1, 2, 1, 1, 3])

x = np.array(list(zip(x1, x2)))
x.reshape(len(x1), 2)
array([[1, 1],
       [2, 3],
       [3, 2],
       [1, 2],
       [5, 8],
       [6, 6],
       [5, 7],
       [5, 6],
       [6, 7],
       [7, 1],
       [8, 2],
       [9, 1],
       [7, 1],
       [9, 3]])
我们来看一下这些数据的分布
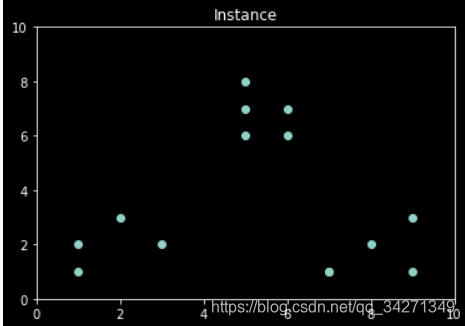
plt.xlim([0, 10])
plt.ylim([0, 10])

plt.title("Instance")

plt.scatter(x1, x2)
<matplotlib.collections.PathCollection at 0x7f6f3ca011d0>
colors = ["b", "g", "r", "c", "m", "y", "k", "b"]  # 点的颜色
markers = ["o", "s", "D", "v", "^", "p", "*", "+"]  # 点的标号
clusters = [2, 3, 4, 5, 8]  # 多尝试几种聚类方案

subplot_counter = 1

sc_scores = []
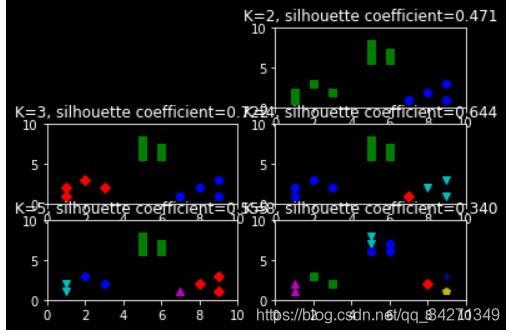
多种聚类,分别看结果
for t in clusters:
    subplot_counter += 1
    plt.subplot(3, 2, subplot_counter)
    kmeans_model = KMeans(n_clusters=t).fit(x)
    for i, l in enumerate(kmeans_model.labels_):
        plt.plot(x1[i], x2[i], color=colors[l], marker=markers[l], ls="None")
    plt.xlim([0, 10])
    plt.ylim([0, 10])
    sc_score = silhouette_score(x, kmeans_model.labels_, metric="euclidean")
    sc_scores.append(sc_score)
    plt.title("K=%s, silhouette coefficient=%0.03f" % (t, sc_score))

plt.figure()
plt.plot(clusters, sc_scores, "*-")

plt.xlabel("Number of Clusters")
Text(0.5, 0, 'Number of Clusters')
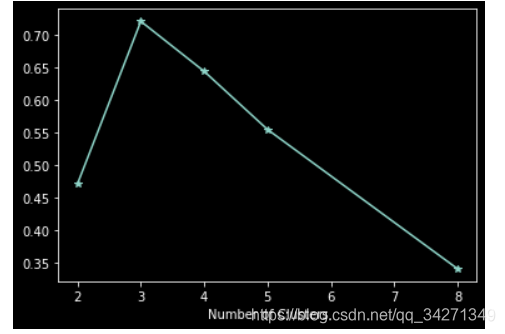
sc_scores
[0.47114752373147084,
 0.7215299149983971,
 0.644424904925249,
 0.5548170502705031,
 0.3401556910283559]
从图中可以看到, 是k=3时的聚类效果最好。从直观上来看,这个评价指标还是不错的。


 753
753


 被折叠的 条评论
为什么被折叠?
被折叠的 条评论
为什么被折叠?
 到【灌水乐园】发言


