


Vue项目实战
图表渲染
安装echarts
package.json:
"dependencies": {

    "vue": "3.4.26",
    "vue-echarts":"6.7.1",
    "echarts":"5.5.0"
  },
图表渲染器(图表组件)
一般负责:
- 整体图表的基础层数据协议设计
schema:{

	type:"line",  //折线图
	data:{

		labels:[],
		datasets:[]
	}
}
- 基于数据协议的图表渲染逻辑
渲染逻辑:通用渲染逻辑、特殊渲染逻辑
BarRenderer.vue、LineRenderer.vue,统一在ChartsRenderer.vue中进行分发渲染(在这一层将不同的图表类型差异磨平) - 图表的事件处理
图表举例:
创建 ChartsRenderer.vue
- components
- ChartsRenderer.vue
<template>
<!-- 一个的写法 -->
<div class="charts-container" ref="container">charts Renderer</div>
<!-- 多个的写法 -->
<!-- <div :ref="(n)=>maps.n=n">charts Renderer1</div>
<div :ref="(b)=>maps.b=b">charts Renderer2</div>
<div :ref="(r)=>maps.r=r">charts Renderer3</div> -->
</template>
<script setup lang="ts">
import {
use,init} from 'echarts'
import {
BarChart,LineChart} from 'echarts/charts'
import {
LegendComponent,TooltipComponent} from 'echarts/components';
import {
onMounted,ref} from 'vue'
use([BarChart,LineChart,LegendComponent,TooltipComponent])
const container=ref<HTMLDivElement|null>(null)
// 多个的写法
// const maps={}
onMounted(()=>{
if(!container.value) return;
const chartInstance= init(container.value)
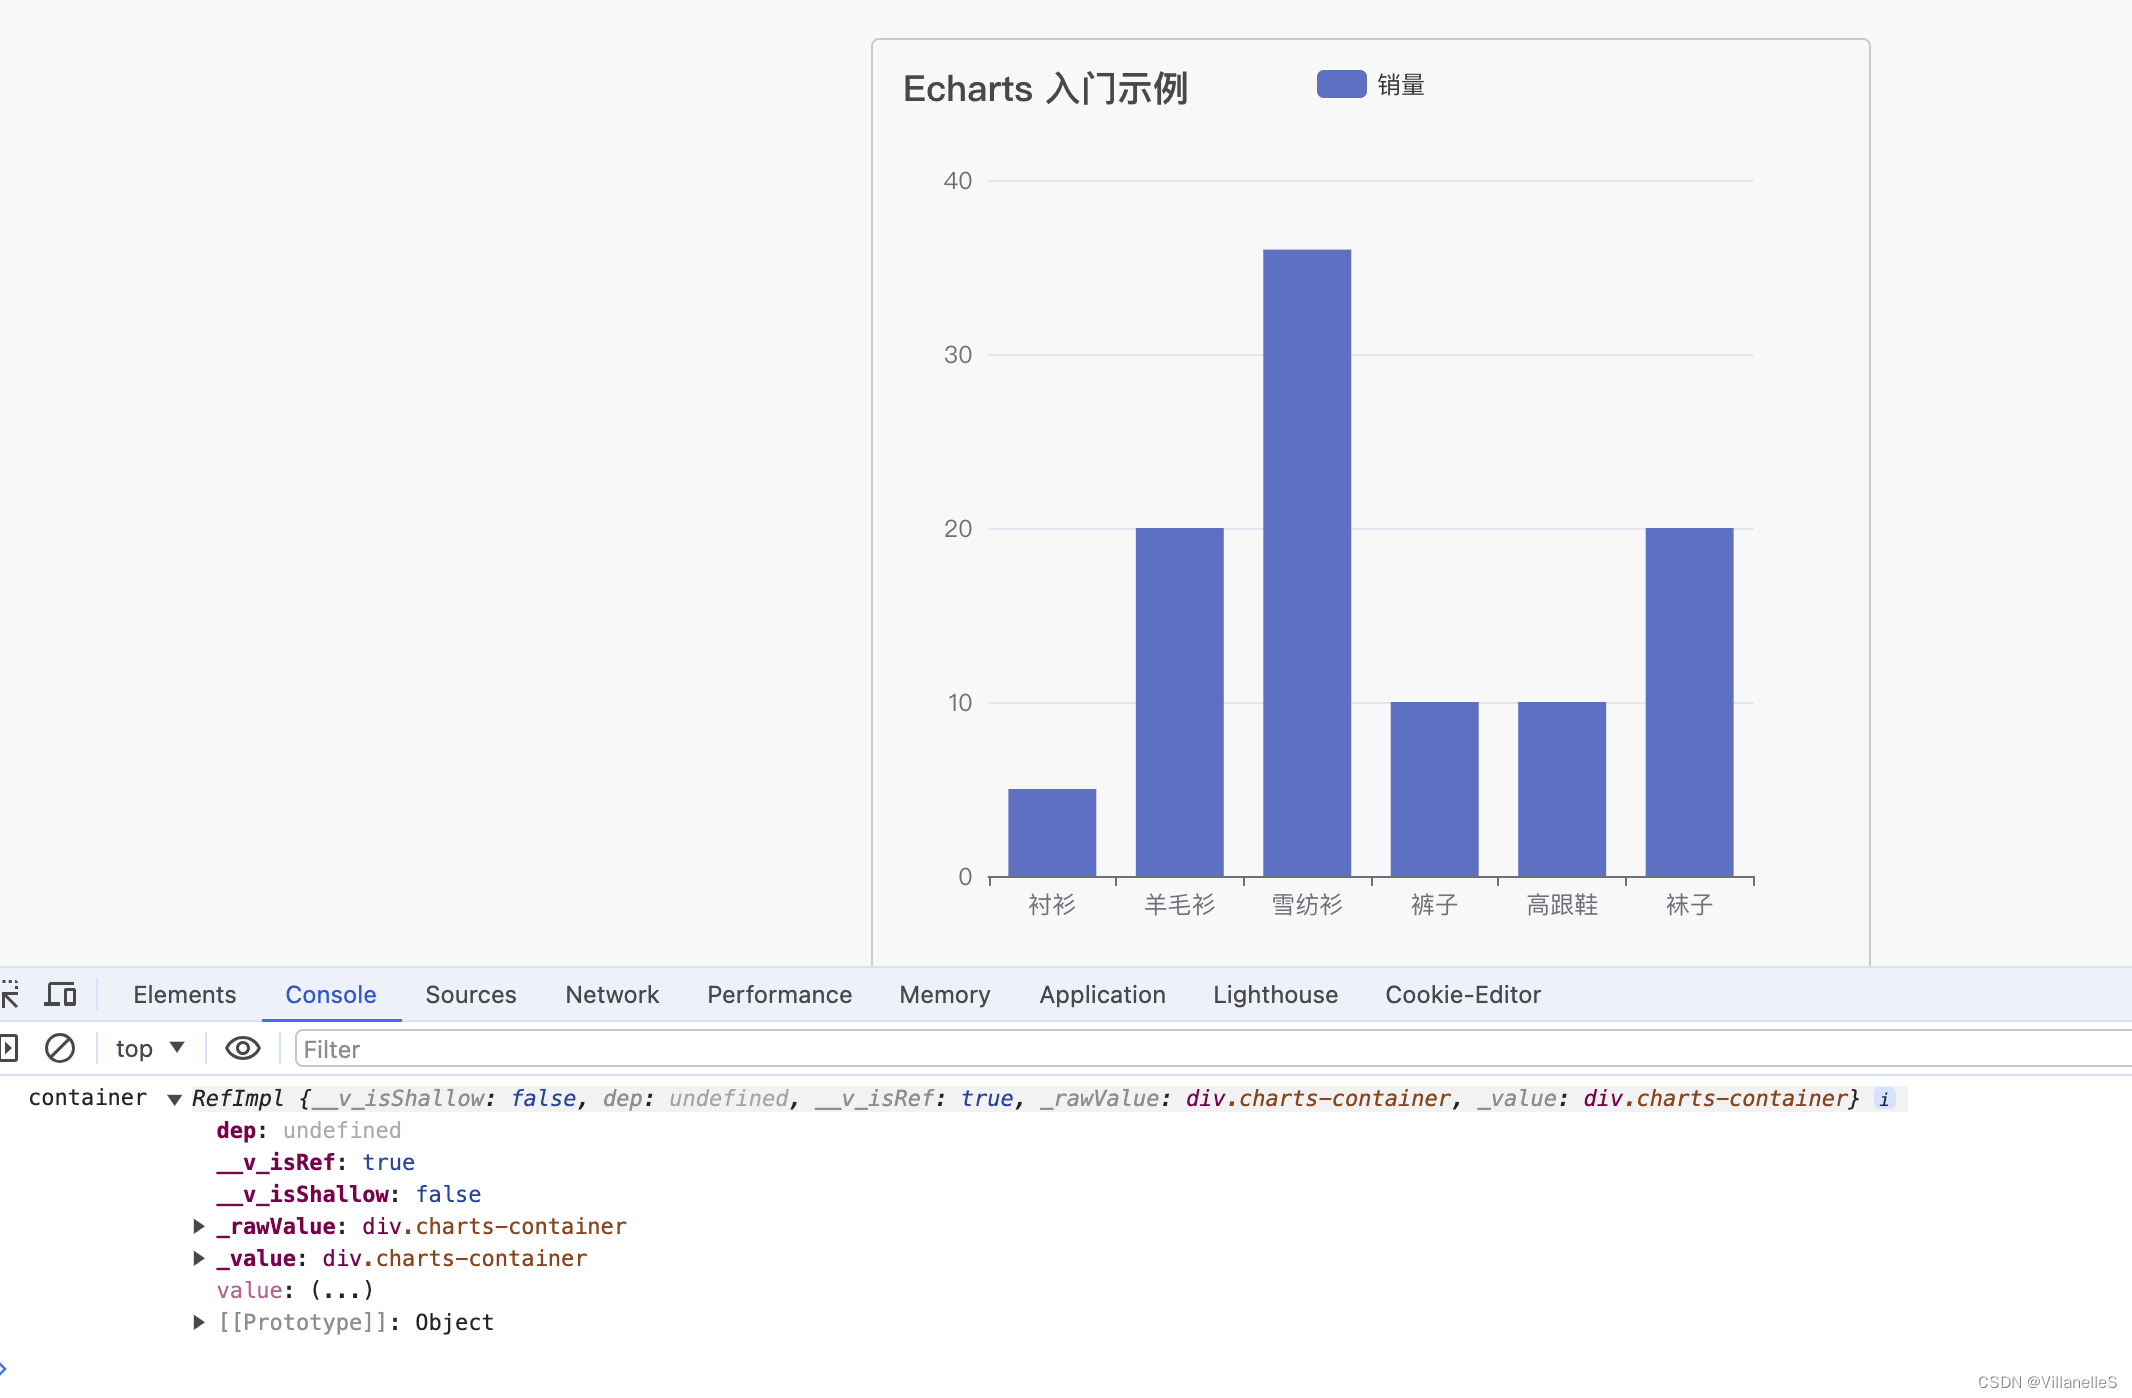
console.log("container",container);
// 多个的写法
// console.log("maps",maps);
chartInstance.setOption({
title:{
text:"Echarts 入门示例"
},
tooltip:{
},
legend:{
data:['销量']
},
xAxis:{
data:['衬衫','羊毛衫','雪纺衫','裤子','高跟鞋','袜子']
},
yAxis:{
},
series:[
{
name:"销量",
type:"bar",
data:[5,20,36,10,10,20]
}
]
})
})
</script>
<style scoped>
.charts-container{
width: 500px;
height: 500px;
border: 1px solid #ccc;
border-radius: 4px;
padding: 10px;
box-sizing: border-box;
}
</style>
App.vue
<script setup lang="ts">
import ChartsRenderer from './components/ChartsRenderer.vue'
</script>
<template>
  <ChartsRenderer></ChartsRenderer>
</template>
项目中:
import {
   use,init,graphic} from 'echarts'
.......
chartInstance.setOption({

  color: ['#80FFA5', '#00DDFF', '#37A2FF', '#FF0087', '#FFBF00'],
  title: {

    text: '渐变堆叠面积图'
  },
  tooltip: {

    trigger: 'axis',
    axisPointer: {

      type: 'cross',
      label: {

        backgroundColor: '#6a7985'
      }
    }
  },
  legend: {

    data: ['Line 1', 'Line 2', 'Line 3', 'Line 4', 'Line 5']
  },
  toolbox: {

    feature: {

      saveAsImage: {
   }
    }
  },
  grid: {

    left: '3%',
    right: '4%',
    bottom: '3%',
    containLabel: true
  },
  xAxis: [
    {

      type: 'category',
      boundaryGap: false,
      data: ['Mon', 'Tue', 'Wed', 'Thu', 'Fri', 'Sat', 'Sun']
    }
  ],
  yAxis: [
    {

      type: 'value'
    }
  ],
  series: [
    {

      name: 'Line 1',
      type: 'line',
      stack: 'Total',
      smooth: true,
      lineStyle: {

        width: 0
      },
      showSymbol: false,
      areaStyle: {

        opacity: 0.8,
        color: new graphic.LinearGradient(0, 0, 0, 1, [
          {

            offset: 0,
            color: 'rgb(128, 255, 165)'
          },
          {

            offset: 1,
            color: 'rgb(1, 191, 236)'
          }
        ])
      },
      emphasis: {

        focus: 'series'
      },
      data: [140, 232, 101, 264, 90, 340, 250]
    },
    {

      name: 'Line 2',
      type: 'line',
      stack: 'Total',
      smooth: true,
      lineStyle: {

        width: 0
      },
      showSymbol: false,
      areaStyle: {

        opacity: 0.8,
        color: new graphic.LinearGradient(0, 0, 0, 1, [
          {

            offset: 0,
            color: 'rgb(0, 221, 255)'
          },
          {

            offset: 1,
            color: 'rgb(77, 119, 255)'
          }
        ])
      },
      emphasis: {

        focus: 'series'
      },
      data: [120, 282, 111, 234, 220, 340, 310]
    },
    {

      name: 'Line 3',
      type: 'line',
      stack: 'Total',
      smooth: true,
      lineStyle: {

        width: 0
      },
      showSymbol: false,
      areaStyle: {

        opacity: 0.8,
        color: new graphic.LinearGradient(0, 0, 0, 1, [
          {

            offset: 0
最低0.47元/天 解锁文章


 736
736

 被折叠的 条评论
为什么被折叠?
被折叠的 条评论
为什么被折叠?
 到【灌水乐园】发言


