


一、指标的介绍
如果你对机器学习中性能的指标很熟悉,这一部分可以不看
PR曲线,ROC曲线,AUC指标等,Accuracy vs Precision 可参考:PR曲线,ROC曲线,AUC指标等,Accuracy vs Precision
一般来说,提高二分类的 threshold 就能提高 precision,降低 threshold 就能提高 recall,这时便可观察 PR 曲线,得到最优的 threshold。
ROC 曲线与 PR 曲线
二、曲线图绘制
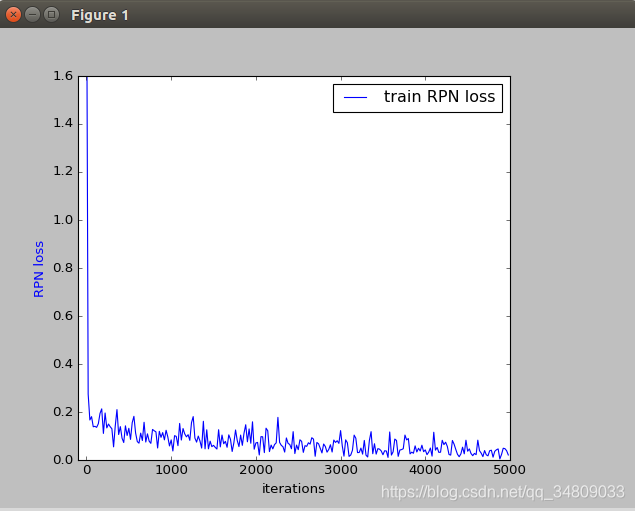
2.1 Loss 曲线图绘制
首先,在训练Faster-Rcnn时会自己生成log文件,大概在/py-faster-rcnn/experiments/logs文件下,把他直接拿出来,放在任意位置即可,因为是txt格式,可以直接用,如果嫌麻烦重命名1.txt.接下来就是编写程序了。
log基本的格式如下:
I0530 08:54:19.183091 10143 solver.cpp:229] Iteration 22000, loss = 0.173712
I0530 08:54:19.183137 10143 solver.cpp:245]     Train net output #0: rpn_cls_loss = 0.101713 (* 1 = 0.101713 loss)
I0530 08:54:19.183145 10143 solver.cpp:245]     Train net output #1: rpn_loss_bbox = 0.071999 (* 1 = 0.071999 loss)
I0530 08:54:19.183148 10143 sgd_solver.cpp:106] Iteration 22000, lr = 0.001
通过发现,我们只需获得 Iteration 和loss就行,代码如下:
#!/usr/bin/env python
# -*- coding: UTF-8 -*-
import os
import sys
import numpy as np
import matplotlib.pyplot as plt
import math
import re
import pylab
from pylab import figure, show, legend
from mpl_toolkits.axes_grid1 import host_subplot

# read the log file
fp = open('2.txt', 'r')

train_iterations = []
train_loss = []
test_iterations = []
#test_accuracy = []


# 遍历每一行
for ln in fp:
  # get train_iterations and train_loss
  if '] Iteration ' in ln and 'loss = ' in ln:
    # 以上图第一行为例,以下的命令匹配的是'ion 22000,'
    arr = re.findall(r'ion \b\d+\b,',ln)
    train_iterations.append(int(arr[0].strip(',')[4:]))

    # 以下寻找的是0.173712,
    # 训练次数过多时运行下行代码,日志文件会报错“ValueError: invalid literal for float(): 0.069speed: 0.056s / iter”
    # train_loss.append(float(ln.strip().split(' = ')[-1])) 进行以下修改

    y = ln.strip().split(' = ')[-1]
    try:
      x = float(y)
    except ValueError:
      ind = y.index('speed')
      x = float(y[0:ind])
    train_loss.append(x)

fp.close()

host = host_subplot(111)
plt.subplots_adjust(right=0.8) # ajust the right boundary of the plot window
#par1 = host.twinx()
# set labels
host.set_xlabel("iterations")
host.set_ylabel("RPN loss")
#par1.set_ylabel("validation accuracy")
# plot curves
p1, = host.plot(train_iterations, train_loss, label="train RPN loss")
#p2, = par1.plot(test_iterations, test_accuracy, label="validation accuracy")

# set location of the legend,
# 1->rightup corner, 2->leftup corner, 3->leftdown corner
# 4->rightdown corner, 5->rightmid ...
host.legend(loc=1)

# set label color
host.axis["left"].label.set_color(p1.get_color())
#par1.axis["right"].label.set_color(p2.get_color())
# set the range of x axis of host and y axis of par1
host.set_xlim([-100,5000])
host.set_ylim([0., 1.6])
plt.draw()
plt.show()
2.2 画PR图
方法1:
Faster R-CNN 训练网络在输出网络模型的同级文件夹里有每一类检测目标每类图片的准确率和召回率, 可以绘制准确率召回率 (Precision-recall, PR) 曲线, PR 曲线的面积即准确率的值. 该文件存储在 ==output\faster_rcnn_end2end\voc_2007_test\zf_faster_rcnn_iter== 下的. pkl 文件下
#!/usr/bin/env python
#-*-coding:utf-8-*-
import cPickle as pickle
import numpy as np
import matplotlib.pyplot as plt
import pylab
from pylab import figure, show, legend
from mpl_toolkits.axes_grid1 import host_subplot


np.set_printoptions(threshold=np.NaN)
fr = open('/home/root1/py-faster-rcnn-alt/output/faster_rcnn_alt_opt/voc_2007_test/VGG_CNN_M_1024_faster_rcnn_final/knife_pr.pkl')                  # open 的参数是 pkl 文件的路径
inf = pickle.load(fr)           # 读取 pkl 文件的内容, 即反序列化
precision = inf["prec"]         # precision数据
recall = inf["rec"]             # recall数据
ap = inf["ap"]                  # ap数据
fr.close()                      # 关闭文件

host = host_subplot(111)
plt.subplots_adjust(right=0.8) # ajust the right boundary of the plot window
#par1 = host.twinx()
# set labels
host.set_xlabel("Recall")
host.set_ylabel("Precision")
#par1.set_ylabel("validation accuracy")
# plot curves
p1, = host.plot(recall, precision, label='knife (area = {:.4f})'.format(ap))
#p2, = par1.plot(test_iterations, test_accuracy, label="validation accuracy")

# set location of the legend,
# 1->rightup corner, 2->leftup corner, 3->leftdown corner
# 4->rightdown corner, 5->rightmid ...
host.legend(loc=1)
pylab.title("Precision-Recall")  # 标题

# set label color
host.axis["left"].label.set_color(p1.get_color())
#par1.axis["right"].label.set_color(p2.get_color())
# set the range of x axis of host and y axis of par1
host.set_xlim([0,1.1])
host.set_ylim([0,1.1])
plt.draw()
plt.show()
执行完上面的程序后,即可完成 PR 曲线的绘制. 效果图如图 所示.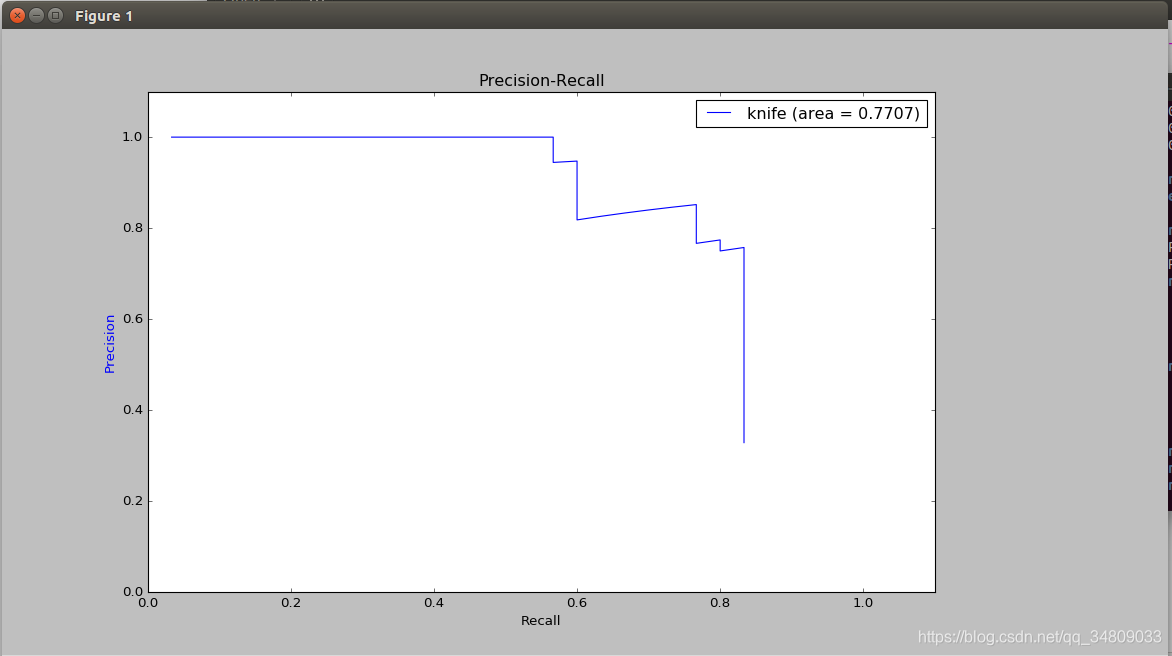
可以将pkl文件换为. txt 文件,主要方便阅读. 代码如下:
#-*-coding:utf-8-*-
import cPickle as pickle
import numpy as np
np.set_printoptions(threshold=np.NaN)
fr = open('./aeroplane_pr.pkl')    # open 的参数是 pkl 文件的路径
inf = pickle.load(fr)              # 读取 pkl 文件的内容
print inf
fo = open("aeroplane_pr.txt", "wb")
fo.write(str(inf))
fo.close()
fr.close()                         # 关闭文件
方法2:
- 修改pascal_voc.py文件
(1) 在pascal_voc.py文档开头添加以下头文件
(2)修改_do_python_eval函数import matplotlib.pyplot as plt import pylab as pl from sklearn.metrics import precision_recall_curve from itertools import cycledef _do_python_eval(self, output_dir = 'output'): annopath = os.path.join( self._devkit_path, 'VOC' + self._year, 'Annotations', '{:s}.xml') imagesetfile = os.path.join( self._devkit_path, 'VOC' + self._year, 'ImageSets', 'Main', self._image_set + '.txt') cachedir = os.path.join(self._devkit_path, 'annotations_cache') aps = [] # The PASCAL VOC metric changed in 2010 use_07_metric = True if int(self._year) < 2010 else False print 'VOC07 metric? ' + ('Yes' if use_07_metric else 'No') if not os.path.isdir(output_dir): os.mkdir(output_dir) for i, cls in enumerate(self._classes): if cls == '__background__': continue filename = self._get_voc_results_file_template().format(cls) rec, prec, ap = voc_eval( filename, annopath, imagesetfile, cls, cachedir, ovthresh=0.5, use_07_metric=use_07_metric) aps += [ap] # 修改处:添加以下一行代码××××××××××××××××××××××××××××××××××××××××××××××××××××××××××× pl.plot(rec, prec, lw=2, label='Precision-recall curve of class {} (area = {:.4f})' ''.format(cls, ap)) print('AP for {} = {:.4f}'.format(cls, ap)) with open(os.path.join(output_dir, cls + '_pr.pkl'), 'w') as f: cPickle.dump({'rec': rec, 'prec': prec, 'ap': ap}, f) print('Mean AP = {:.4f}'.format(np.mean(aps))) print('~~~~~~~~') print('Results:') for ap in aps: print('{:.3f}'.format(ap)) print('{:.3f}'.format(np.mean(aps))) print('~~~~~~~~') print('') print('--------------------------------------------------------------') print('Results computed with the **unofficial** Python eval code.') print('Results should be very close to the official MATLAB eval code.') print('Recompute with `./tools/reval.py --matlab ...` for your paper.') print('-- Thanks, The Management') print('--------------------------------------------------------------') # 修改处,添加以下代码×××××××××××××××××××××××××××××××××××××××××××××××××××××××××× pl.xlabel('Recall') pl.ylabel('Precision') plt.grid(True) pl.ylim([0.0, 1.05]) pl.xlim([0.0, 1.0]) pl.title('Precision-Recall') pl.legend(loc="upper right") plt.show() - 在py-faster-rcnn目录下,执行以下命令,在此我以VGG_CNN_M_1024模型的交替优化训练为例。所以需要修改这里的模型位置和名称,以及yml的位置
./tools/test_net.py --gpu 0 --def models/pascal_voc/VGG_CNN_M_1024/faster_rcnn_alt_opt/faster_rcnn_test.pt --net output/faster_rcnn_alt_opt/voc_2007_trainval/VGG_CNN_M_1024_faster_rcnn_final.caffemodel --cfg experiments/cfgs/faster_rcnn_alt_opt.yml


 4358
4358


 被折叠的 条评论
为什么被折叠?
被折叠的 条评论
为什么被折叠?
 到【灌水乐园】发言


