


安装并且启动alertmanager
alertmanager.yml
global:
    resolve_timeout: 5m
route:
    group_by: ['alertname']
    group_wait: 30s
    group_interval: 1m
    repeat_interval: 2m
    receiver: webhook1
receivers:
  - name: 'webhook1'
    webhook_configs:
      - url: 'http://10.31.18.157:8060/dingtalk/webhook1/send'
        send_resolved: true     # 表示服务恢复后会收到恢复告警
#    当已经发送的告警通知匹配到target_match和target_match_re规则,当有新的告警规则如果满足source_match或者定义的匹配规则,并且已发送的告警与新产生的告警中equal定义的标签完全相同,则启动抑制机制,新的告警不会发送。
docker run -d -p 9093:9093 --name my_alertmanager  \
-v /opt/prometheus/alertmanager.yml:/etc/alertmanager/alertmanager.yml \
-v /etc/localtime:/etc/localtime:ro \
 prom/alertmanager
安装钉钉插件
#可以选择两个版本  最新版 和1.40版本  两种启动方式有点不太一样
docker pull timonwong/prometheus-webhook-dingtalk
docker pull timonwong/prometheus-webhook-dingtalk:v1.4.0
对新版配置钉钉规则模板 config.yml 1.4不需要
## Request timeout
# timeout: 5s

## Customizable templates path
#    此处进行告警模板的指定,不要时使用 --template.file= 进行指定,否则会报错,只会识别tempaltefile 而不去识别指定dingdingwebhook的 配置文件
# templates:
#    - /usr/local/prometheus-webhook-dingtalk/template/*.tmp
targets:
    webhook1:
        url: https://oapi.dingtalk.com/robot/send?access_token=f50b6f2f31f6192fcfa0f27ddceaac07f1b7b5d27c3289cf04301014fa1b386d
        # secret for signature
        secret: SEC5691a8d16e0fc926f81f0348d4bd4ce0cce5c207e1b71cadca79598b3905018c
启动钉钉插件
新版本将 tempaltefile 指定集成到了 配置文件中,只需要在配置文件中指定template file 的位置就行了
docker run -d --restart always -p 8060:8060  \
--name webhook-dingding  \
-v /opt/prometheus/config.yml:/etc/prometheus/config.yml  \
-v /etc/localtime:/etc/localtime  \
 timonwong/prometheus-webhook-dingtalk
1.4版本启动
docker run -d -p 8060:8060 \
--name webhook1  timonwong/prometheus-webhook-dingtalk:v1.4.0 \
--ding.profile="webhook1=https://oapi.dingtalk.com/robot/send?access_token=f50b6f2f31f6192fcfa0f27ddceaac07f1b7b5d27c3289cf04301014fa1b386d"
配置推送规则 :rule_files![]() https://download.csdn.net/download/qq_34936628/86393710
https://download.csdn.net/download/qq_34936628/86393710
rules:注意使用时修改 是自己需要监控的job_name
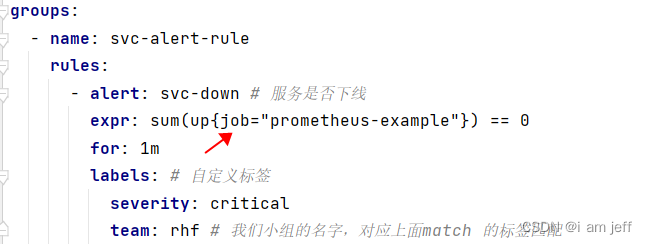
prometheus 配置 报警和识别抓取对象实例
# my global config
global:
  # Set the scrape interval to every 15 seconds. Default is every 1 minute.
  # 将抓取间隔设置为每 15 秒。 默认为每 1 分钟。
  scrape_interval: 15s
  # Evaluate rules every 15 seconds. The default is every 1 minute.
  # 每 15 秒评估一次规则。 默认值为每 1 分钟。
  evaluation_interval: 15s
  # scrape_timeout is set to the global default (10s).

# Alertmanager configuration
# 警报管理器配置
alerting:
  alertmanagers:
    - static_configs:
        - targets: ["10.**.**.***:9093"]
#           - alertmanager:9093

# Load rules once and periodically evaluate them according to the global 'evaluation_interval'.
# 加载规则一次并根据全局“evaluation_interval”定期评估它们。
rule_files:
  - "rules/*.yml"

  # - "first_rules.yml"
  # - "second_rules.yml"

# A scrape configuration containing exactly one endpoint to scrape:
# 一种抓取配置,只包含一个要抓取的端点
# Here it's Prometheus itself.
scrape_configs:
  # The job name is added as a label `job=<job_name>` to any timeseries scraped from this config.
  - job_name: "prometheus"

    # metrics_path defaults to '/metrics'
    # scheme defaults to 'http'.

    static_configs:
      - targets: ["localhost:9090"]
       # The job name is added as a label `job=<job_name>` to any timeseries scraped from this config.

  - job_name: 'cadvisor'

    static_configs:
      - targets: ['10.**.**.***:8081']
      # scheme defaults to 'http'.

  - job_name: 'prometheus-example'
    scrape_interval: 5s
    # 抓取的端点 这个是springboot项目集成监控的默认请求路径
    metrics_path: '/actuator/prometheus'
    static_configs:
       # 目标机器,数组,也就是说支持集群拉取
      - targets: [ '10.**.**.***:8082' ]
启动prometheus容器
#配置规则路径  用-v 实现统一配置管理
docker run -itd --name prometheus -p 9090:9090 \
-v /opt/prometheus/prometheus.yml:/etc/prometheus/prometheus.yml \
-v /opt/prometheus/rules/:/etc/prometheus/rules/ \
-v /etc/localtime:/etc/localtime:ro \
prom/prometheus


 4716
4716


 被折叠的 条评论
为什么被折叠?
被折叠的 条评论
为什么被折叠?
 到【灌水乐园】发言


