


pandas通过提供一个作用域序列和数据框的函数plot,简化了基于序列和数据框中的数据创建图标的过程。
1.Series
Series是一种一维的数组型对象,包含了一个值序列,并且包含了数据标签,称为索引。
import pandas as pd

s=pd.Series([1,2,3,4,5])
s.values               //获取s的值
s.index                //获取s的索引属性

s=pd.Series([20,21,22],index=['H','S','W'])
如果已有数据包含在Python字典中,可以使用字典生成一个Series
s=pd.Series( dict )

s['H']
s.loc['H']
s.iloc[0]                         //显示都为20,获取的是‘H’对应的值
s.shape
s.size

Series对象和其索引都有name属性,这个特性与pandas其他重要功能集成在一起
s.name
s.index.name

s.head(2)
s.describe()               //获取s的详细信息
s.sort_values             //排序
s[s>20]                //获取s中属性值大于20的元素
s.plot.bar()                 //画柱状图
s_dict = s.to_dict             //将s转化为dict类型

s.drop_duplicates()          //删除重复值

pd.isnull(s)                  //判断s中各元素是否为空值
pd.notnull(s)                 //    pandas中使用isnull和notnull函数来检查缺失数据
2.DataFrame
DataFrame表示的是矩阵的数据表,它包含已排序的列集合,每一列可以是不同的值类型。
df = pd.DataFrame({ 'student_1':[20,20,19]',student_2':[19,20,19] } ,index=['M','T','W'] )
df = pd.DataFrame([ [1,2,3],[4,5,6] ],index=['M','T'],columns=[ 'c1','c2','c3' ] )
//index为索引横坐标值,columns为列坐标值。
如果你指定了列的顺序,DataFrame( data,columns['A','B','C'] )

另一个常用的数据形式是包含字典的嵌套字典:
p = { 'A':{01:hhh},'B':{02:jjj}}
frame = pd.DataFrame( p )
pandas会将字典的键作为列,将内部字典的键作为行索引。

索引对象是不可变的,用户是无法修改索引对象的。
index[1] = 'd'   TypeError

del方法可以用于移除之前新建的列:
del frame[' columns ']


Method
df.head()              //取头
df.tail()                  //取尾
df.describe()
df.loc['b','c']           //取索引为b,columns为c的值
df.iloc[1,1]
df['c2'] = df.apply( lambda x:x['c2']**2+10,axis=1)    //取c2列的值做 **+10 的运算.
3.基本功能
①重建索引
Series调用reindex方法时,会将数据按照新的索引进行排列,如果某个索引值之前不存在,则会引入缺失值:
i = pd.Series([1,2,3,4],index=['d','c',b'','a'])
i2 = i.reindex(['a','b','c','d','e'])
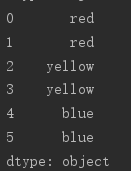
对于顺序数据,比如时间序列,在重建索引时可能会需要进行插值或填值。method可选参数允许我们使用诸如ffill等方法在重建索引时插值,ffill方法会将值向前填充(bfill向后填充) :
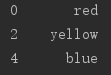
i = pd.pandas(['red','yellow','blue'],index=[0,2,4])
i.reindex(range(6),method='ffill')
②轴向上删除条目
-----------------Series中向上删除条目
新建:
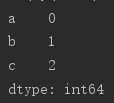
i = pd.Series(range(3), index=['a', 'b', 'c'])
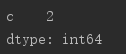
删除:
i.drop(['a', 'b'])
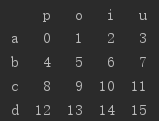
-----------------Dataframe中,索引值可以从轴向上删除
新建:
g = pd.DataFrame(np.arange(16).reshape((4, 4)), index=['a', 'b', 'c', 'd'], ,columns=['p', 'o', 'i', 'u'])
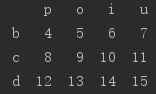
在调用drop时使用标签序列会根据行标签删除值(轴0)
g.drop(['a'])
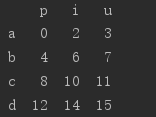
可以通过传递axis=1或axis=‘columns’来从列中删除值
g.drop(['o'],axis='columns')
绘图实例:使用数据框中的数据创建一对条形图和箱线图
import pandas as pd
import numpy as np
import matplotlib.pyplot as plt
plt.style.use('ggplot')
fig,axes = plt.subplots(nrows=1, ncols=2)  //创建一个基础图和两个并排放置的子图
ax1,ax2 = axes.ravel()  //使用reval函数将两个子图分别赋值给ax1和ax2
data_frame = pd.DataFrame(np.random.rand(5, 3), index=['C1', 'C2', 'C3', 'C4', 'C5'], columns=pd.Index(['M1', 'M2', 'M3'], name='Metrics'))
data_frame.plot(kind='bar', ax=ax1, alpha=0.75, title='Bar Plot')
 //在左侧子图中创建一个条形图
plt.setp(ax1.get_xticklabels(), rotation=45, fontsize=10)
plt.setp(ax1.get_yticklabels(), rotation=0, fontsize=10)  //设置x,y轴旋转角度和字体大小
ax1.set_xlabel('customer')
ax1.set_ylabel('value')
ax1.xaxis.set_ticks_position('bottom')
ax1.yaxis.set_ticks_position('left')

colors = dict(boxes='DarkBlue',whiskers='Gray',medians='Red',caps='Black')
//为箱线图创建一个颜色字典
data_frame.plot(kind='box', color=colors, sym='r.', ax=ax2, title='Box Plot')
//创建一个箱线图,使用colors变量为各部分着色,将离群点形状设置为红色圆点
plt.setp(ax2.get_xticklabels(), rotation=45, fontsize=10)
plt.setp(ax2.get_yticklabels(), rotation=0, fontsize=10)
ax2.set_xlabel('Metric')
ax2.set_ylabel('Value')
ax2.xaxis.set_ticks_position('bottom')
ax2.yaxis.set_ticks_position('left')
plt.savefig('pandas_plots.png', dpi=400, bbox_inches='tight')
plt.show()


 1319
1319


 被折叠的 条评论
为什么被折叠?
被折叠的 条评论
为什么被折叠?
 到【灌水乐园】发言


