


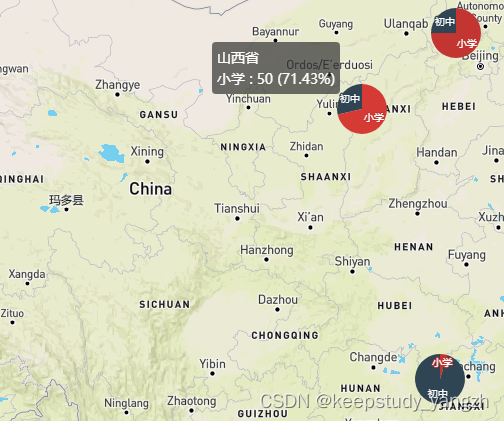
实现效果
思路
1.引用mapboxgl脚本库及样式库与echart脚本库。
2.准备专题数据,此处我们使用模拟数据,使用json模拟后台返回的统计数据。【专题数据包含行政区划坐标、统计字段(多个)】
eg:
| 行政区划编码 | 行政区划坐标 | 行政区划名称 | 统计字段 | 统计字段2 |
|---|---|---|---|---|
| 110000 | [经度,维度] | 北京市 | 100 | 200 |
| 行政区划编码 | [经度2,维度2] | xx省 | 50 | 210 |
| 3.使用mapboxgl api中的Marker在地图上加载专题数据中的行政区划的点坐标,然后将每个Marker渲染成div,并将每个marker的div的id设置跟专题数据的每条数据对应起来。 | ||||
| 4.使用echart 通过专题数据的行政区划编码将每个行政区划的div初始化为饼状图,生成专题图层。 |
实现过程
1.在页面引入相关依赖
    <script src="https://api.tiles.mapbox.com/mapbox-gl-js/v1.6.1/mapbox-gl.js"></script>
    <link href="https://api.tiles.mapbox.com/mapbox-gl-js/v1.6.1/mapbox-gl.css" rel="stylesheet" />
    <script src="https://cdn.jsdelivr.net/npm/echarts@3.8.5/dist/echarts.js"></script>
2.加载底图
function addBasicMap(){
  mapboxgl.accessToken =
      "your mapboxgl access_token";
    window.map = new mapboxgl.Map({
      container: "thematicMapDiv",
      style: "mapbox://styles/mapbox/streets-v11",
       center: [117.9, 33.5],
       zoom: 4
    });}
3.加载专题点坐标
//加载专题地图
function addThematicEchartLayer() {
      //销毁echartLists
      clearEchartInstantAndPoint();
	  //专题数据处理及加载到地图
      window.thematicdata.forEach(element => {
        var geojson = JSON.parse(element.GEOJSON);
        var el1 = document.createElement("div");
        el1.id = "thematicchart" + element.XZQH;
        el1.style = "height:100px;width:100px;";
        //加载专题点坐标
      window.echartMapPoints.push( new mapboxgl.Marker(el1, { offset: [-50 / 2, -50 / 2] })
          .setLngLat([
            geojson.geometry.coordinates[0],
            geojson.geometry.coordinates[1]
          ])
          .addTo(window.map));
		  //echart初始化专题图
		  addEchartInit(element);

})}
4.使用echart生成专题图。
备注:(此处可以根据系统需求,使用饼状图、扇形图等,参考echart api)
//echart初始化专题图
function addEchartInit(element){
		var data = [];
        Object.keys(window.thematicHeader).forEach(key => {
          if (key.indexOf("BZ") != -1) {
            data.push({ name: window.thematicHeader[key], value: element[key] });
          }
          });
        var option1 = {
            tooltip : {
            trigger: 'item',
            formatter: "{a}<br/>{b} : {c} ({d}%)"
          },
          series: {
            name:element.XZQHMC,
            type: "pie",
            data: data,
            radius: "50%",
            center: ["50%", "50%"],
            label: {
              normal: {
                position: "inner",
                fontSize:10
              },

            }
          }
        };
		window.echartInitLists.push(initEchart("thematicchart" + element.XZQH, option1));


}
//初始化echart表
function initEchart(id,options){
  var mychart = echarts.init(document.getElementById(id));
  mychart.setOption(options);
  return mychart;
}
全部代码
<!DOCTYPE html>
<html>
<head>
    <meta charset="utf-8">
    <title>vue-manage-system</title>
    <meta name="viewport" content="width=device-width,initial-scale=1,minimum-scale=1,maximum-scale=1,user-scalable=no">

    <!-- mapbox-gl -->
    <script src="https://api.tiles.mapbox.com/mapbox-gl-js/v1.6.1/mapbox-gl.js"></script>
    <link href="https://api.tiles.mapbox.com/mapbox-gl-js/v1.6.1/mapbox-gl.css" rel="stylesheet" />
	<!-- echart-->
    <script src="https://cdn.jsdelivr.net/npm/echarts@3.8.5/dist/echarts.js"></script>

</head>
<body>
<div style=" width: 100%;
  height: 100%;
  position: absolute;" id="thematicMapDiv"></div>
<script>
//数据为模拟数据,仅供参考
window.onload=function(){
	addBasicMap();
	//专题数据
	window.thematicdata=[{"XZQH":"110000","BZ3":30.0,"XZQHMC":"北京市","BZ2":10.0,"GEOJSON":"{\"type\": \"Feature\",\"properties\": {},\"geometry\": {\"type\": \"Point\",\"coordinates\": [116.412616834352,40.1855914174138 ]}}"},{"XZQH":"140000","BZ3":50.0,"XZQHMC":"山西省","BZ2":20.0,"GEOJSON":"{\"type\": \"Feature\",\"properties\": {},\"geometry\": {\"type\": \"Point\",\"coordinates\": [112.288799420842,37.5712486062551 ]}}"},{"XZQH":"220000","BZ3":500.0,"XZQHMC":"吉林省","BZ2":300.0,"GEOJSON":"{\"type\": \"Feature\",\"properties\": {},\"geometry\": {\"type\": \"Point\",\"coordinates\": [126.187672031028,43.6682548638262 ]}}"},{"XZQH":"360000","BZ3":100.0,"XZQHMC":"江西省","BZ2":2000.0,"GEOJSON":"{\"type\": \"Feature\",\"properties\": {},\"geometry\": {\"type\": \"Point\",\"coordinates\": [115.72225295253,27.6141576799222 ]}}"}];
	window.thematicHeader={"XZQH":"行政区划","BZ3":"小学","XZQHMC":"行政区划名称","BZ2":"初中","GEOJSON":"坐标"};
	//需要清理的对象
	 window.echartMapPoints=[];
	 window.echartInitLists=[];

	addThematicEchartLayer();

}
//加载底图
function addBasicMap(){
  //这个可以自己去mapboxgl官网申请key
  mapboxgl.accessToken =
      "pk.eyJ1IjoieWFuZ3pob3VoYW8iLCJhIjoiY2ppbG9sMXJnMXc5YjNxbnhrOWl1bXppMyJ9.-JL3W32NYV_lHqsTUIGw9Q";
    window.map = new mapboxgl.Map({
      container: "thematicMapDiv",
      style: "mapbox://styles/mapbox/streets-v11",
       center: [117.9, 33.5],
       zoom: 4
    });
}

//加载专题地图
function addThematicEchartLayer() {
      //销毁echartLists
      clearEchartInstantAndPoint();
	  //专题数据处理及加载到地图
      window.thematicdata.forEach(element => {
        var geojson = JSON.parse(element.GEOJSON);
        var el1 = document.createElement("div");
        el1.id = "thematicchart" + element.XZQH;
        el1.style = "height:100px;width:100px;";
        window.echartMapPoints.push( new mapboxgl.Marker(el1, { offset: [-50 / 2, -50 / 2] })
          .setLngLat([
            geojson.geometry.coordinates[0],
            geojson.geometry.coordinates[1]
          ])
          .addTo(window.map));
		  //echart初始化专题图
		  addEchartInit(element);

})}

//echart初始化专题图
function addEchartInit(element){
		var data = [];
        Object.keys(window.thematicHeader).forEach(key => {
          if (key.indexOf("BZ") != -1) {
            data.push({ name: window.thematicHeader[key], value: element[key] });
          }
          });
        var option1 = {
            tooltip : {
            trigger: 'item',
            formatter: "{a}<br/>{b} : {c} ({d}%)"
          },
          series: {
            name:element.XZQHMC,
            type: "pie",
            data: data,
            radius: "50%",
            center: ["50%", "50%"],
            label: {
              normal: {
                position: "inner",
                fontSize:10
              },

            }
          }
        };
		window.echartInitLists.push(initEchart("thematicchart" + element.XZQH, option1));


}
//初始化echart表
function initEchart(id,options){
  var mychart = echarts.init(document.getElementById(id));
  mychart.setOption(options);
  return mychart;
}

//清除echart及marker
function clearEchartInstantAndPoint(){
		window.echartInitLists.forEach(echartItem => {
                  echartItem.dispose();
          });
        window.echartMapPoints.forEach(pointItem => {
            pointItem.remove();
          });
}
</script>
</body>
</html>


 572
572


 被折叠的 条评论
为什么被折叠?
被折叠的 条评论
为什么被折叠?
 到【灌水乐园】发言


