


一.开发准备
https://www.echartsjs.com/zh/index.html
先去这里把Echarts的js下载
建一个html页面

二.代码部分
1.第一个注意点
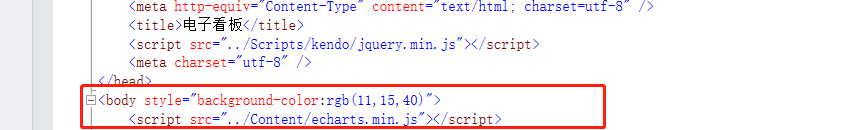
一定要把Echarts的js放在body里面,自己写的js部分也要放在body里面,不然会找不到控件的
2.第二个注意点
可以定义一个div来容纳这个图标

使用jquery来选择,并转换成实例
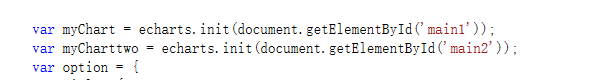
3.使用myChart来进行实例化
var option = {
title: {
text: ‘七日完成率’,
textStyle: { color: “#1DAAD7” },
left: ‘center’
},
        legend: {

            bottom: 10,
            left: 'center',
            data: ['计划量', '完成量'],
            textStyle: { color: "#7C785F" },
        },
        series: [
            {
                type: 'pie',
                radius: '65%',
                center: ['50%', '50%'],
                selectedMode: 'single',
                label: {
                    normal: {
                        show: true,
                        position: 'inside',
                        formatter: '{d}%',//模板变量有 {a}、{b}、{c}、{d},分别表示系列名,数据名,数据值,百分比。{d}数据会根据value值计算百分比

                        textStyle: {
                            align: 'center',
                            baseline: 'middle',
                            fontFamily: '微软雅黑',
                            fontSize: 15,
                            fontWeight: 'bolder'
                        }
                    },
                },

                data: [

                    { value: 75, name: '计划量', itemStyle: { color: "#F49913" } },
                    { value: 25, name: '完成量', itemStyle: { color: "#1DAAD7" } }
                ],


            }
        ]
    };
    // 使用刚指定的配置项和数据显示图表。
    myChart.setOption(option);
    实例化完就能看到报表了


 610
610


 被折叠的 条评论
为什么被折叠?
被折叠的 条评论
为什么被折叠?
 到【灌水乐园】发言


