


echarts官方文档:
http://echarts.baidu.com/doc/doc.html#简介
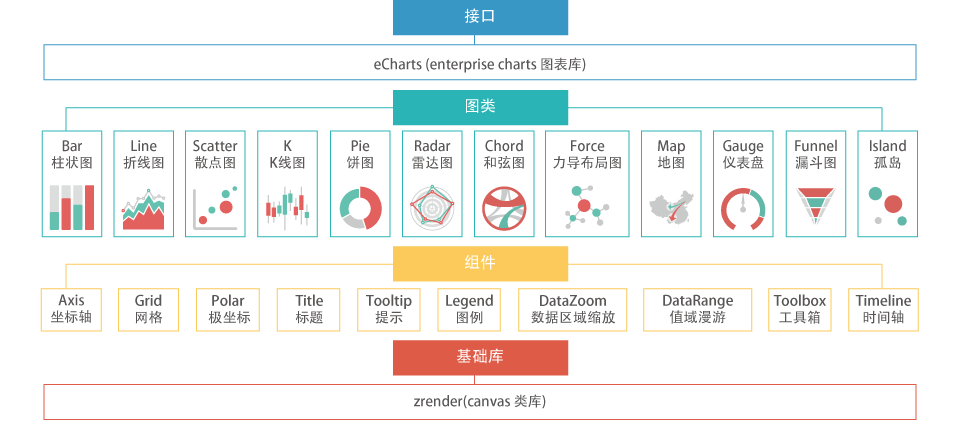
ECharts,缩写来自Enterprise Charts,商业级数据图表,一个纯Javascript的图表库,可以流畅的运行在PC和移动设备上,兼容当前绝大部分浏览器(IE6/7/8/9/10/11,chrome,firefox,Safari等),底层依赖轻量级的Canvas类库ZRender,提供直观,生动,可交互,可高度个性化定制的数据可视化图表。创新的拖拽重计算、数据视图、值域漫游等特性大大增强了用户体验,赋予了用户对数据进行挖掘、整合的能力。
支持折线图(区域图)、柱状图(条状图)、散点图(气泡图)、K线图、饼图(环形图)、雷达图(填充雷达图)、和弦图、力导向布局图、地图、仪表盘、漏斗图、事件河流图等12类图表,同时提供标题,详情气泡、图例、值域、数据区域、时间轴、工具箱等7个可交互组件,支持多图表、组件的联动和混搭展现。
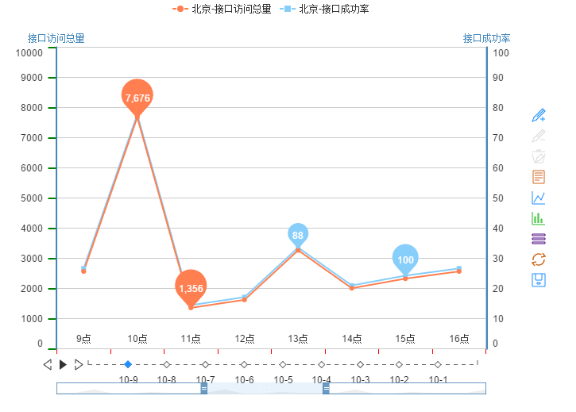
第一种:数据写死在前台
先贴一张效果图:(HTML静态页面,主要考虑图标展现效果)
实例页面的下载地址:
http://download.csdn.net/detail/lmb55/9241793
echarts页面的开发主要有两部步:
1、设定一个存放图标的div;
2、调用画图方法进行画图;
2.1 初始化将要存放echarts图表的DOM对象(div);
myChart = echarts.init(document.getElementById('main')); 2.2 编写echarts图表需要的属性(option);
var options = { …… };2.3 将属性注入图表
myChart.setOption(options);Demo.jsp
<!DOCTYPE html>
<html>
<head>
<meta charset="utf-8">
<title>ECharts</title>
<link type="text/css" rel="stylesheet" href="bootstrap/css/bootstrap.css" />
<link type="text/css" rel="stylesheet" href="bootstrap/css/bootstrap-theme.min.css" />
<script src="bootstrap/js/jquery-1.11.3.min.js"></script>
<script src="bootstrap/js/bootstrap.min.js"></script>
</head>
<body>
<!-- 为ECharts准备一个具备大小(宽高)的Dom -->
<div id="main" style="height:500px;width:750px;float:left"></div>
<script src="http://echarts.baidu.com/build/dist/echarts.js"></script>
<script type="text/javascript">
// 路径配置(echarts正常显示需要加载的文件所在路径)
require.config({
paths: {
echarts: 'echarts-2.2.7/build/dist'
}
});
// 使用
require(
[
'echarts',
'echarts/chart/bar',
'echarts/chart/line' // 使用柱状图就加载bar模块,按需加载
],
//功能:绘制需要显示的图形
function drewEcharts(ec) {
//通过id属性,在相应的div中初始化echarts图表
myChart = ec.init(document.getElementById('main'));
var option = {
timeline: {//时间轴
data: [
'10-9',
'10-8',
'10-7',
'10-6',
'10-5',
'10-4',
'10-3',
'10-2',
'10-1'
],
height: 80,
x: 50,
padding: [
30,
10,
10,
10
],
autoPlay: false,//设置是否自动轮转
playInterval: 2000//设置自动轮转时间
},
options:[
//接口访问总量横纵坐标轴设置
{//图标属性
calculable:true,
title : {
// text: '接口访问总量',
// subtext: '当前为周统计视图' ,
x:'left'
},
dataZoom : {//数据区域缩放(滚动条)
show : true,
realtime : true,
start : 30,//从30%开始展现
// y:20,
// dataBackgroundColor:"green",
end : 60,//在60%的数据处截止
//witdh:5,
height:15
},
tooltip : {//提示
trigger: 'axis',
formatter: ""
},
legend: {//图例(根据实际需要可设置多个,多个图例之间用英文逗号隔开)
data:['接口实时并发量']
},
toolbox: {//辅助工具箱,辅助功能,如添加标线,框选缩放等
x: 'right',
y: 'center',
orient : 'vertical',
show : true,
feature : {//定义一些特色小功能,
mark : {show: true},
dataView : {show: true, readOnly: false},
restore : {show: true},
saveAsImage : {show: true}
}
},
//对X坐标轴进行设置
xAxis : [
{
type : 'category',
position: 'bottom',
boundaryGap: true,
axisLine : { // x轴线的设置
show: false,
//设置X坐标轴线的显示风格
lineStyle: {
color: 'green',
type: 'solid',
width: 2
}
},
axisTick : { // X轴坐标点标记
show:true,
length: 5,
//设置X坐标轴坐标点的显示风格
lineStyle: {
color: 'red',
type: 'solid',
width: 1
}
},
axisLabel : {//X轴数据风格
show:true,
interval: 'auto', // {number}刻度的长短,可设为数字
rotate: 0,
margin:-20,
splitNumber: 18,
formatter: '',//Template formatter!'{value}单位'
/* textStyle: {
color: 'blue',
fontFamily: 'sans-serif',
fontSize: 15,
fontStyle: 'italic',
fontWeight: 'bold'
}*/
},
splitLine : {
show:false,
lineStyle: {
color: '#483d8b',
type: 'dashed',
width: 1
}
},
/* splitArea : {
show: true,
areaStyle:{
color:['rgba(144,238,144,0.3)','rgba(135,200,250,0.3)']
}
},*/
data : [//X轴刻度
'0:00','0:10','0:20','0:30','0:40','0:50','1:00','1:10','1:20','1:30','1:40','1:50','2:00','2:10','2:20','2:30','2:40','2:50','3:00']
}
],
//对Y坐标轴进行设置
yAxis : [
{
type : 'value',
'name':'接口访问总量',
position: 'left',
splitNumber: 10,
boundaryGap: [0,0.1],
axisLine : { // 左边y轴线
show: true,
/*lineStyle: {
color: 'red',
type: 'dashed',
width: 2
}*/
},
axisTick : { //左边y轴坐标标记点
show:true,
length: 10,
lineStyle: {
color: 'green',
type: 'solid',
width: 2
}
},
axisLabel : {//Y轴数据风格
show:true,
interval: 10,//'auto', // {number}
rotate: 0,//左边Y轴左边数据的选择角度
margin: 18,
formatter: '{value}', // Template formatter!'{value}单位'
},
},
],
series : [//数据系列,一个图表可能包含多个系列,每一个系列可能包含多个数据
{
name: '接口访问总量',
type: 'line',
//Y轴需要显示的数据
data:[2325, 2565, 5676,1356, 1622, 3266, 2007,2325, 2565, 5676,1356, 1622, 3266, 2007,2325, 2565, 5676,1356, 1622, 3266, 2007,2325, 2565, 5676,1356, 1622],
markPoint : {//设置特殊显示点
data : [
{type : 'max', name: '最大值'},
{type : 'min', name: '最小值'}
]},
}
]
},
//接口成功率横纵坐标轴设置
{
calculable:true,
title : {
// text: '接口成功率',
// subtext: '当前为周统计视图' ,
x:'left'
},
dataZoom : {//数据区域缩放,常用于展现大量数据时选择可视范围
show : true,
realtime : true,
start : 30,
// y:20,
// dataBackgroundColor:"green",
end : 60,
witdh:5,
height:15
},
tooltip : {//气泡提示框,常用于展现更详细的数据
trigger: 'axis',
formatter: ""
},
legend: {
data:['接口成功率']
toolbox: {//辅助工具箱,辅助功能,如添加标线,框选缩放等
x: 'right',
y: 'center',
orient : 'vertical',
show : true,
feature : {
mark : {show: true},
dataView : {show: true},
magicType : {show: true, type: ['line','bar', 'stack']},//进行不同图形的转化
restore : {show: true},
saveAsImage : {show: true}
}
},
xAxis : [
{
type : 'category',
position: 'bottom',
boundaryGap: true,
axisLine : { // x轴线轴线的设置
show: false,
lineStyle: {
color: 'green',
type: 'solid',
width: 2
}
},
axisTick : { // X轴坐标点标记
show:true,
length: 5,
lineStyle: {
color: 'red',
type: 'solid',
width: 2
}
},
axisLabel : {//X轴数据风格
show:true,
interval: 'auto', // {number}
rotate: 0,
margin:-20,
splitNumber: 23,
formatter: '{value}点',//Template formatter!'{value}单位'
/* textStyle: {
color: 'blue',
fontFamily: 'sans-serif',
fontSize: 15,
fontStyle: 'italic',
fontWeight: 'bold'
}*/
},
splitLine : {
show:false,
lineStyle: {
color: '#483d8b',
type: 'dashed',
width: 1
}
},
/* splitArea : {
show: true,
areaStyle:{
color:['rgba(144,238,144,0.3)','rgba(135,200,250,0.3)']
}
},*/
data : [
'0:00','0:10','0:20','0:30','0:40','0:50','1:00','1:10','1:20','1:30','1:40','1:50','2:00','2:10','2:20','2:30','2:40','2:50','3:00']
}
],
yAxis : [
{
type : 'value',
'name':'接口成功率',
position: 'left',
splitNumber: 10,
boundaryGap: [0,0.1],
axisLine : { // 左边y轴线
show: true,
/*lineStyle: {
color: 'red',
type: 'dashed',
width: 2
}*/
},
axisTick : { //左边y轴坐标标记
show:true,
length: 10,
lineStyle: {
color: 'green',
type: 'solid',
width: 2
}
},
axisLabel : {
show:true,
interval: 10,//'auto', // {number}定义横坐标刻度长短
rotate: 0,//左边Y轴左边数据的选择角度
margin: 18,
formatter: '{value}', // Template formatter!'{value}单位'
},
}
],
//可用grid属性控制图表大小
grid : {
width : '90%'
},
series : [
{
name: '接口成功率',
type: 'line',
data:[2325, 2565, 7676,1356, 1622, 3266, 2007],
markPoint : {
data : [
{type : 'max', name: '最大值'},
{type : 'min', name: '最小值'}
]},
}
]
}]};
// 为echarts对象加载数据
myChart.setOption(option);
}
);
</script>
</body>
</html>
第二种:前后台数据交互实现echarts图表
实现原理:基于springmvc的controller注解。前台页面通过请求controller方法进行数据的获取,获取成功将数据设置到相应的位置上;controller中可以从数据库或者其他的第三方系统取数据,本例采用简单实现,直接将数据在controller中给出;
实例解析:
DynamicInteractionDemo.jsp
<!DOCTYPE html>
<html lang="en">
<head>
    <meta charset="utf-8">
    <meta http-equiv="X-UA-Compatible" content="IE=edge">
    <meta name="viewport" content="width=device-width, initial-scale=1.0">
    <meta name="description" content="ECharts">
    <meta name="author" content="kener.linfeng@gmail.com">
    <title>ECharts · 前后台交互Demo</title>
    <% request.setAttribute("ctx", request.getContextPath() ) ; %>
    <link rel="shortcut icon" href="${ctx}/config/echarts/echarts/doc/asset/ico/favicon.png">
    <link href="${ctx}/config/echarts/echarts/doc/asset/css/font-awesome.min.css" rel="stylesheet">
    <link href="${ctx}/config/echarts/echarts/doc/asset/css/bootstrap.css" rel="stylesheet">
    <link href="${ctx}/config/echarts/echarts/doc/asset/css/carousel.css" rel="stylesheet">
    <link href="${ctx}/config/echarts/echarts/doc/asset/css/echartsHome.css" rel="stylesheet">
    <!-- HTML5 shim and Respond.js IE8 support of HTML5 elements and media queries -->
    <!--[if lt IE 9]>
      <script src="https://oss.maxcdn.com/html5shiv/3.7.2/html5shiv.min.js"></script>
      <script src="https://oss.maxcdn.com/respond/1.4.2/respond.min.js"></script>
    <![endif]-->
    <!--   -->
    <script src="${ctx}/config/echarts/echarts/src/echarts.js"></script>
    <script src="${ctx}/config/echarts/echarts/doc/asset/js/codemirror.js"></script>
    <script src="${ctx}/config/echarts/echarts/doc/asset/js/javascript.js"></script>
    <link href="${ctx}/config/echarts/echarts/doc/asset/css/codemirror.css" rel="stylesheet">
    <link href="${ctx}/config/echarts/echarts/doc/asset/css/monokai.css" rel="stylesheet">
</head>

<body>
    <div id="main" class="main"></div>//存放图表的div

    <!-- ECharts单文件引入 -->
    <script src="${ctx}/config/echarts/echarts/build/dist/echarts-all.js"></script>

     <script type="text/javascript" language="javascript">
         //调用画图方法进行画图
        DrawEChart(echarts);
        //创建绘制ECharts图表的方法
        function DrawEChart(echarts) {
            var myChart;
            alert('DrawEChart()');
            myChart = echarts.init(document.getElementById('main'));
            myChart.showLoading({
                text : "图表数据正在努力加载..."
            });
            //定义图表属性options
            var options = {
                title : {
                    text : "未来一周气温变化",
                    subtext : "纯属虚构",
                    sublink : "http://www.baidu.com"
                },
                tooltip : {
                    trigger : 'axis'
                },
                legend : {
                    data : [ "最高气温" ]
                },
                toolbox : {
                    show : true,
                    feature : {
                        mark : {
                            show : true
                        },
                        dataView : {
                            show : true,
                            readOnly : false
                        },
                        magicType : {
                            show : true,
                            type : [ 'line', 'bar' ]
                        },
                        restore : {
                            show : true
                        },
                        saveAsImage : {
                            show : true
                        }
                    }
                },
                calculable : true,
                xAxis : [ {
                    type : 'category',
                    boundaryGap : false,
                    data : [ '1', '2', '3', '4', '5', '6', '7' ]
                } ],
                yAxis : [ {
                    type : 'value',
                    axisLabel : {
                        formatter : '{value} °C'
                    },
                    splitArea : {
                        show : true
                    }
                } ],
                grid : {
                    width : '90%'
                },
                series : [ {
                    name : '最高气温',
                    type : 'line',
                    data : [ 11, 22, 33, 44, 55, 33, 44 ],//必须是Integer类型的,String计算平均值会出错
                    markPoint : {
                        data : [ {
                            type : 'max',
                            name : '最大值'
                        }, {
                            type : 'min',
                            name : '最小值'
                        } ]
                    },
                    markLine : {
                        data : [ {
                            type : 'average',
                            name : '平均值'
                        } ]
                    }
                } ]
            };
            myChart.setOption(options); //先把可选项注入myChart中
            myChart.hideLoading();
            alert('ending');
            //设置延迟
            setTimeout( function getChartData() {
                alert('getChartData()' + options);
                //获得图表的options对象
                //var options = myChart.getOption();
                //alert(options),
                //通过Ajax获取数据
                $.ajax({
                    url : "${ctx}/restservice/echarts",//springmvc的controller的请求路径
                    type : "post",
                    //async : true, //同步执行
                    data : {},
                    dataType : "json", //返回数据形式为json
                    success : function(result) {
                        if (result) {
                            alert('requestSuccess');
                            //请求成功将数据设置到相应的位置上
                            options.legend.data = result.legend;
                            options.xAxis[0].data = result.category;
                            options.series[0].data = result.series[0].data;

                            myChart.hideLoading();
                            myChart.setOption(options);
                        }
                    },
                    error : function(xmlHttpRequest,errorMsg,exceptionObject) {
                        alert("requestError");
                        alert('xmlHttpRequest>>>>>' + xmlHttpRequest + ' errorMsg>>>>>' + errorMsg + ' exceptionObject>>>>>' + exceptionObject);
                        myChart.hideLoading();
                    }
                });
            } ,100);
            //getChartData(myChart);//aja后台交互
        };
    </script>
    <!-- Le javascript
    ================================================== -->
    <!-- Placed at the end of the document so the pages load faster -->
    <script src="${ctx}/config/echarts/echarts/doc/asset/js/jquery.min.js"></script>
    <script type="text/javascript" src="${ctx}/config/echarts/echarts/doc/asset/js/echartsHome.js"></script>
    <script src="${ctx}/config/echarts/echarts/doc/asset/js/bootstrap.min.js"></script>
    <script src="${ctx}/config/echarts/echarts/doc/asset/js/echartsExample.js"></script>
</body>
</html>
获取 && 封装表单数据的controller:
DynamicInteractionController.java
package com.hollycrm.hollyuniproxy.controller;

import java.util.ArrayList;
import java.util.Arrays;
import java.util.List;
import javax.servlet.http.HttpServletRequest;
import org.apache.commons.logging.Log;
import org.apache.commons.logging.LogFactory;
import org.springframework.stereotype.Controller;
import org.springframework.web.bind.annotation.RequestBody;
import org.springframework.web.bind.annotation.RequestMapping;
import org.springframework.web.bind.annotation.RequestMethod;
import org.springframework.web.bind.annotation.ResponseBody;
import com.alibaba.fastjson.JSON;

@Controller
public class DynamicInteractionController {

    private Log logger = LogFactory.getLog(EchartsController.class);

    @RequestMapping(value = "/echarts", method=RequestMethod.POST,produces="text/plain;charset=UTF-8")
    public @ResponseBody String echartsHandler(@RequestBody String json,HttpServletRequest req) {
        logger.debug("进入echartsHandler方法体>>>>>>>>>>>>>>>>>>>>>>>>>");
        List<String> legend = new ArrayList<String>(Arrays.asList(new String[]{"最高气温"}));//数据分组
        List<String> category = new ArrayList<String>(Arrays.asList(new String []{"周一","周二","周三","周四","周五","周六","周日"}));//横坐标
        List<Series> series = new ArrayList<Series>();//纵坐标
        series.add(new Series("最高气温", "line",new ArrayList<Integer>(Arrays.asList(21,23,28,26,21,33,44))));
        EchartData data=new EchartData(legend, category, series);
        logger.debug("echartsHandler返回的字符串>>>>>>>>>>>>>>>" + JSON.toJSONString(data));
        return JSON.toJSONString(data);
    }
}用于封装表单数据的javabean:
EchartData:
package com.hollycrm.hollyuniproxy.controller;

import java.util.ArrayList;
import java.util.List;

public class EchartData {

    public List<String> legend = new ArrayList<String>();//数据分组
    public List<String> category = new ArrayList<String>();//横坐标
    public List<Series> series = new ArrayList<Series>();//纵坐标

    public EchartData(List<String> legendList, List<String> categoryList, List<Series> seriesList) {
        super();
        this.legend = legendList;
        this.category = categoryList;
        this.series = seriesList;
    }

}封装纵坐标的javabean:
Series.java:
package com.hollycrm.hollyuniproxy.controller;

import java.util.List;

public class Series {

    public String name;

    public String type;

    public List<Integer> data;//这里要用int 不能用String 不然前台显示不正常(特别是在做数学运算的时候)

    public Series( String name, String type, List<Integer> data) {
        super();
        this.name = name;
        this.type = type;
        this.data = data;
    }

}
我以上例子只给出了一种图形示例,需要使用别的图形时之需更改个别属性即可。最后感谢提供如此强大的数据图表库的echarts团队。
ps:控制图表大小有两种方式:
1、限定存放图表的div的大小;
2、使用grid属性设定图表大小;
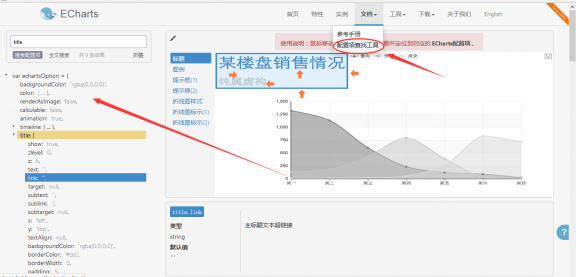
echarts官方给出的文档中可以查看每个属性的具体含义和设置:


 3万+
3万+

 被折叠的 条评论
为什么被折叠?
被折叠的 条评论
为什么被折叠?
 到【灌水乐园】发言


