


第一章:认识GOJS
<template>
  <div class="main">
    <div id="myOverviewDiv"></div>
    <div class="flowChart" id="flowChart"></div>
  </div>
</template>

<script>
const MAKE = go.GraphObject.make;
export default {
  name: "WangLuoGuiHua",
  data() {
    return {
      myDiagram: null,
    };
  },
  methods: {
    init() {
      this.myDiagram = MAKE(go.Diagram, "flowChart", {
        initialContentAlignment: go.Spot.Center,
      });
      this.myDiagram.nodeTemplate = MAKE(
        go.Node,
        "Auto",
        MAKE(go.Shape, "RoundedRectangle", new go.Binding("fill", "color")),
        MAKE(go.TextBlock, { margin: 3 }, new go.Binding("text", "key"))
      );
      this.myDiagram.model = new go.GraphLinksModel(
        [
          // a JavaScript Array of JavaScript objects, one per node;
          // the "color" property is added specifically for this app
          { key: "Alpha", color: "lightblue" },
          { key: "Beta", color: "orange" },
          { key: "Gamma", color: "lightgreen" },
          { key: "Delta", color: "pink" },
        ],
        [
          // a JavaScript Array of JavaScript objects, one per link
          { from: "Alpha", to: "Beta" },
          { from: "Alpha", to: "Gamma" },
          { from: "Beta", to: "Beta" },
          { from: "Gamma", to: "Delta" },
          { from: "Delta", to: "Alpha" },
        ]
      );
    },
  },
  mounted() {
    this.init();
  },
};
</script>

<style scoped>
.main {
  color: aqua;
}
.flowChart {
  margin: 10px auto 0;
  width: 95%;
  height: 800px;
  background-color: rgb(218, 239, 245);
}
</style>
效果如下:

总结一:简单案例
// 引入gojs
// 1、下载依赖
npm install --save gojs
// 2、main.js引入、挂载
import gojs from 'gojs'
Vue.prototype.go = gojs

// 在vue页面js部分
// 定义一个变量承载go.GraphObject.make的静态函数库,后面会频繁使用到;
// 建议定义在公共区间
const MAKE = go.GraphObject.make;
// 选择要渲染的div
this.myDiagram = MAKE(go.diagram, 'flowChart',
{initialContentAlignment: go.Spot.Center})
// 定义节点生成样式
this.myDiagram.nodeTemplate = MAKE(go.Node, 'Auto',
MAKE(go.Shape, 'RoundedRectangle', new Binding('fill', 'color')),
MAKE(go.TextBlock, { margin: 3 }, new Binding('text', 'key')))
// 选择一种模型将数据写入图表,需要将自己的数据转成固定的格式 关键字是‘key’
this.myDiagram.model = new go.GraphLinksModel([
{ key: 'Alpha', color: 'lightblue'},
{ key: 'Beta', color: 'orange' }],
[{ from: 'Alpha', to: 'Beta' }])
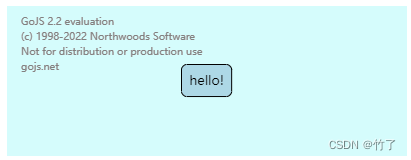
通过代码创建 | Building with Code
<!DOCTYPE html>
<html lang="en">
  <head>
    <meta charset="UTF-8" />
    <meta http-equiv="X-UA-Compatible" content="IE=edge" />
    <meta name="viewport" content="width=device-width, initial-scale=1.0" />
    <script src="https://unpkg.com/gojs/release/go-debug.js"></script>
    <title>Demo</title>
  </head>
  <body>
    <div
      id="chartid"
      style="width:400px; height:150px; background-color: #d5fcfc;"
    ></div>
    <script>
      const GOMAKE = go.GraphObject.make;
      const mydiagram = GOMAKE(go.Diagram, "chartid");
      const node = new go.Node(go.Panel.Auto);
      const shape = new go.Shape();
      shape.figure = "RoundedRectangle";
      shape.fill = "lightblue";
      node.add(shape);
      const textblock = new go.TextBlock();
      textblock.text = "Hello!";
      textblock.margin = 5;
      node.add(textblock);
      mydiagram.add(node);
    </script>
  </body>
</html>
效果如下:

总结二:通过代码创建节点
// 引入gojs就不赘述了,直接干货
// 1、引入gojs
// 2、定义变量承接go.GrahpObject.make函数库
const GOMAKE = go.GraphObject.make;
// 3、创建画布
const mydiagram = GOMAKE(go.Diagram, "chartid");
// 4、定义新节点的样式
const node = new go.Node(go.Panel.Auto);
/*
*    节点样式是通过图表对象的模板以及一些设置属性实现的,要创建一个节点我们有几个类需要处理。
*    - Shape:外形, 去展示预定义的或默认的尺寸及颜色等
*    - TextBlock:文本块, 展示各式各样的字体
*    - Picture:图片, 展示图片
*    - Panel:面板, 可以放置其他对象像tables等
*/
// 设置节点的外形、颜色
const shape = new go.Shape();
// 设置节点的形状为圆角矩形
shape.figure = "RoundedRectangle";
// 设置节点的填充颜色为亮蓝色
shape.fill = "lightblue";
// 将设置好的节点样式添加为节点的属性
node.add(shape);
// 设置节点的文本
const textblock = new go.TextBlock();
// 设置节点的文字内容为:‘hello!’
textblock.text = "Hello!";
// 设置节点文字样式:外边距为5
textblock.margin = 5;
// 将设置好的节点样式添加为节点的属性
node.add(textblock);
// 5、在画布中添加一个节点
mydiagram.add(node);
通过链式函数创建 | Building with Chaining Functions
<!DOCTYPE html>
<html lang="en">
  <head>
    <meta charset="UTF-8" />
    <meta http-equiv="X-UA-Compatible" content="IE=edge" />
    <meta name="viewport" content="width=device-width, initial-scale=1.0" />
    <script src="https://unpkg.com/gojs/release/go-debug.js"></script>
    <title>Demo</title>
  </head>
  <body>
    <div
      id="chartid"
      style="width:400px; height:150px; background-color: #d5fcfc;"
    ></div>
    <script>
      const GOMAKE = go.GraphObject.make;
      const mydiagram = GOMAKE(go.Diagram, "chartid");
      // Create a node and .add a Shape and TextBlock to it
      mydiagram.add(
        new go.Node("Auto")
          .add(
            new go.Shape("RoundedRectangle", {
              fill: "lightblue",
              strokeWidth: 3,
            })
          )
          .add(
            new go.TextBlock("Hello!", {
              margin: 5,
            })
          )
      );
    </script>
  </body>
</html>
效果如下:
总结三:通过链式函数创建节点
// 这个链式调用太好用了
通过 GraphObject.make 创建节点 | Building with GraphObject.make
<!DOCTYPE html>
<html lang="en">
  <head>
    <meta charset="UTF-8" />
    <meta http-equiv="X-UA-Compatible" content="IE=edge" />
    <meta name="viewport" content="width=device-width, initial-scale=1.0" />
    <script src="https://unpkg.com/gojs/release/go-debug.js"></script>
    <title>Demo</title>
  </head>
  <body>
    <div
      id="chartid"
      style="width:400px; height:150px; background-color: #d5fcfc;"
    ></div>
    <script>
      const GOMAKE = go.GraphObject.make;
      const mydiagram = GOMAKE(go.Diagram, "chartid");
      mydiagram.add(
        GOMAKE(
          go.Node,
          go.Panel.Auto,
          GOMAKE(go.Shape, {
            figure: "RoundedRectangle",
            fill: "lightblue",
          }),
          GOMAKE(go.TextBlock, {
            text: "hello!",
            margin: 5,
          })
        )
      );
      mydiagram.add(
        GOMAKE(
          go.Node,
          "Auto",
          GOMAKE(go.Shape, "TriangleRight", { fill: "rgb(5, 203, 253)" }),
          GOMAKE(go.TextBlock, "摇曳幸运的小小小小鱼", { margin: 5 })
        )
      );
      // GraphObject.make还可以用来构建从GraphObject继承的类之外的GoJS类。
      // 下面是使用go.GraphObject.make 构建一个 Brush 而不是 GraphObject子类 的示例。
      // GraphObject.make also works to build GoJS classes other than ones inheriting from GraphObject.
      // Here is an example of using go.GraphObject.make to build a Brush rather than a GraphObject subclass.
      mydiagram.add(
        GOMAKE(
          go.Node,
          "Auto",
          GOMAKE(go.Shape, "Ellipse", {
            fill: GOMAKE(go.Brush, "Linear", { 0.0: "Violet", 1.0: "yellow" }),
          }),
          GOMAKE(go.TextBlock, "水晶灯", { margin: 5 })
        )
      );
    </script>
  </body>
</html>
效果如下(为了美观,生成后我拖动了一下才截图的):

总结四: 通过 GraphObject.make 创建节点
// 全部属性前面都应该加'go.'
mydiagram.add(
    GOMAKE(
        go.Node,
        go.Panel.Auto,
        GOMAKE(go.Shape, { figure: "RoundedRectangle", fill: "lightblue" }),
        GOMAKE(go.TextBlock, { text: "hello!", margin: 5 })
    )
);
/*  go.GrahpObject.make函数库(GOMAKE)集成了很多属性,在调用的时候可以通过'go.'直接调用
 *  GOMAKE(go.Node, go.Panel.Auto, 生成node和panel,
 *  在node的下层调用GOMAKE(go.Shape,{内置键值对,需要查阅文档})
 *  在node的下层调用GOMAKE(go.TextBlock,{内置键值对,需要查阅文档})
 *
*/

// Panel.type、Shape.figure 和 TextBlock.text 属性为且仅为字符串时可以省略,默认占第二个参数位置
mydiagram.add(
    GOMAKE(
        go.Node,
        "Auto",
        GOMAKE(go.Shape, "TriangleRight", { fill: "rgb(5, 203, 253)" }),
        GOMAKE(go.TextBlock, "摇曳幸运的小小小小鱼", { margin: 5 })
    )
);

// 使用go.GraphObject.make除了可以调用GraphObject的子类之外,还可以构建非GraphObject子类的函数
mydiagram.add(
    GOMAKE(
        go.Node,
        "Auto",
        GOMAKE(go.Shape, "Ellipse", {
            // 比如这里go.GraphObject.make就构建了一个Brush刷子函数
            fill: GOMAKE(go.Brush, "Linear", { 0.0: "Violet", 1.0: "yellow" }),
        }),
        GOMAKE(go.TextBlock, "水晶灯", { margin: 5 })
    )
);
通过 GraphObject.make 创建图表
      const GOMAKE = go.GraphObject.make;
      const mydiagram = GOMAKE(go.Diagram, "chartid",// must name or refer to the DIV HTML element
      // "chartid"必须是div的名称或者引用,一般是id或者ref(vue中可使用this.$refs.dulingfengsao)。
      {
        // don't initialize some properties until after a new model has been loaded
        // 在新模型加载后再初始化的属性
        "InitialLayoutCompleted": loadingDiagramProperties, // a DiagramEvent listener 一个图表事件监听函数
        // have mouse wheel events zoom in and out instead of scroll up and down
        // 将鼠标滚轮事件从使画布上下移动替换为使画布放大缩小
        "toolManager.mouseWheelBehavior": go.ToolManager.WheelZoom,
        // specify a data object to copy for each new Node that is created by clicking
        // 定义新生成节点的模板
        "clickCreatingTool.archetypeNodeData": { text: "新节点" }
      });
      // the DiagramEvent listener for "InitialLayoutCompleted"
      function loadDiagramProperties(e) { console.log(e) }
<!DOCTYPE html>
<html lang="en">
<head>
<meta charset="UTF-8" />
<meta http-equiv="X-UA-Compatible" content="IE=edge" />
<meta name="viewport" content="width=device-width, initial-scale=1.0" />
<script src="https://unpkg.com/gojs/release/go-debug.js"></script>
<title>Demo</title>
</head>
<body>
<div
id="chartid"
rsf="dulingfengsao"
style="margin:20px auto; width:90%; height:850px; background-color: #b19cb3;"
></div>
<script>
const GOMAKE = go.GraphObject.make;
const mydiagram = GOMAKE(
go.Diagram,
"chartid", // must name or refer to the DIV HTML element
// "chartid"必须是div的名称或者引用,一般是id或者ref(vue中可使用this.$refs.dulingfengsao)。
{
// // don't initialize some properties until after a new model has been loaded
// // 在新模型加载后再初始化的属性
// InitialLayoutCompleted: loadingDiagramProperties, // a DiagramEvent listener 一个图表事件监听函数
// have mouse wheel events zoom in and out instead of scroll up and down
// 将鼠标滚轮事件从使画布上下移动替换为使画布放大缩小
"toolManager.mouseWheelBehavior": go.ToolManager.WheelZoom,
// specify a data object to copy for each new Node that is created by clicking
// 定义新生成节点的模板
"clickCreatingTool.archetypeNodeData": { text: "新节点" },
}
);
// // the DiagramEvent listener for "InitialLayoutCompleted"
// function loadDiagramProperties(e) {
// console.log(e);
// }
// All of this initialization using GraphObject.make is still JavaScript code, so we can call functions and easily share objects such as brushes:
// 所有这些使用GraphObject.make的初始化仍然是JavaScript代码,因此我们可以调用函数并轻松共享对象,例如画笔:
const rosebrush = GOMAKE(go.Brush, "Linear", {
0.5: "RoyalBlue",
1.0: "MistyRose",
0.0: "MistyRose",
});
const violetbrush = GOMAKE(go.Brush, "Linear", {
0.5: "Violet",
1.0: "MistyRose",
0.0: "MistyRose",
});
mydiagram.add(
GOMAKE(
go.Node,
"Auto",
GOMAKE(go.Shape, "RoundedRectangle", { fill: rosebrush }),
GOMAKE(go.TextBlock, "不缺失", { margin: 5 })
)
);
mydiagram.add(
GOMAKE(
go.Node,
"Auto",
GOMAKE(go.Shape, "Ellipse", { fill: violetbrush }),
GOMAKE(go.TextBlock, "价值观", { margin: 5 })
)
);
mydiagram.add(
GOMAKE(
go.Node,
"Auto",
GOMAKE(go.Shape, "Ellipse", { fill: violetbrush }),
GOMAKE(go.TextBlock, "人生观", { margin: 5 })
)
);
mydiagram.add(
GOMAKE(
go.Node,
"Auto",
GOMAKE(go.Shape, "Ellipse", { fill: violetbrush }),
GOMAKE(go.TextBlock, "世界观", { margin: 5 })
)
);
</script>
</body>
</html>
效果如下(我使用鼠标滚轮进行了放大):
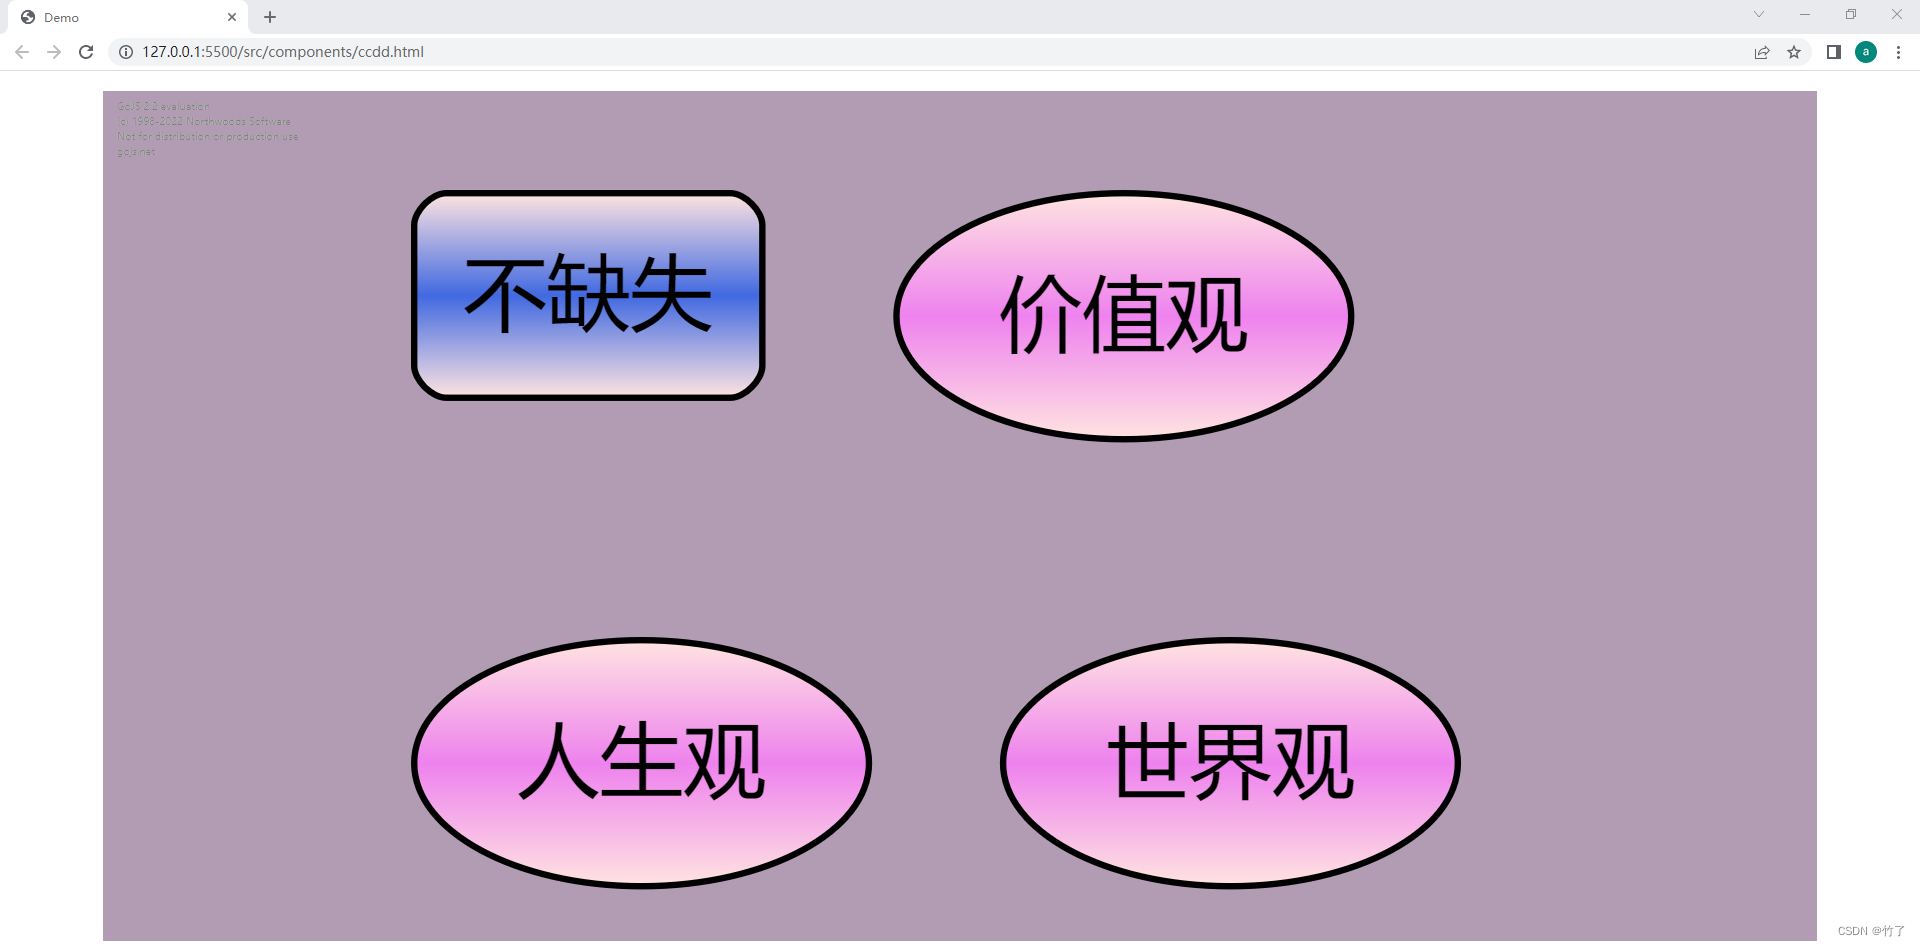
总结五:本章小结
回顾文章开头的案例,我们现在已经明白了部分语句的含义,即使没学到的部分语句,配合着图例也能猜个七七八八的作用,勉强算是入门了。
本文文笔较为拙劣,如果有任何建议,欢迎评论区提出,也可以私信交流,感谢阅读。

第二章:和GOJS的第一次约饭
通过代码创建图表 | Building diagrams with code
<!DOCTYPE html>
<html lang="en">
  <head>
    <meta charset="UTF-8" />
    <meta http-equiv="X-UA-Compatible" content="IE=edge" />
    <meta name="viewport" content="width=device-width, initial-scale=1.0" />
    <script src="https://unpkg.com/gojs/release/go-debug.js"></script>
    <title>Demo</title>
  </head>
  <body>
    <div
      id="chartid"
      style="margin:20px auto; width:90%; height:850px; background-color: #baa4be;"
    ></div>
    <script>
      const GOMAKE = go.GraphObject.make;
      const mydiagram = GOMAKE(go.Diagram, "chartid");
      const boybrush = GOMAKE(go.Brush, "Linear", {
        0.0: "#6161ff",
        1.0: "#fff",
      });
      const girlbrush = GOMAKE(go.Brush, "Linear", {
        0.0: "#f60000",
        1.0: "#fff",
      });
      const nodeBoy = GOMAKE(
        go.Node,
        "Auto",
        GOMAKE(go.Shape, "Ellipse", { fill: boybrush }),
        GOMAKE(go.TextBlock, "龙傲天", { margin: 5 })
      );
      mydiagram.add(nodeBoy);
      const nodeGirl = GOMAKE(
        go.Node,
        "Auto",
        GOMAKE(go.Shape, "Ellipse", { fill: girlbrush }),
        GOMAKE(go.TextBlock, "曲珑珺", { margin: 5 })
      );
      mydiagram.add(nodeGirl);
      mydiagram.add(
        GOMAKE(
          go.Link,
          { fromNode: nodeBoy, toNode: nodeGirl },
          GOMAKE(go.Shape)
        )
      );
    </script>
  </body>
</html>
效果如下(放大和调整了位置):
Chapter 2 - Section 1 总结:通过代码创建图表
// 和上一章相比,本小节案例就是把节点抽出来写在外面,然后在创建节点的时候直接添加节点变量
// 定义一个变量,并定义一个节点保存在变量中
const nodeBoy = GOMAKE(
    go.Node,
    "Auto",
    GOMAKE(go.Shape, "Ellipse", { fill: boybrush }),
    GOMAKE(go.TextBlock, "龙傲天", { margin: 5 })
);
// 创建节点,把定义好的节点变量直接添加到创建节点函数中
mydiagram.add(nodeBoy);

// 新学到的知识就是下面这行创建链接的代码。

/* go.Link 是和go.Node 相类似的一个属性,用来创建节点与节点之间的链接。
 * 在gojs中,LINK 具有和NODE 几乎一样重要的地位和作用以及丰富的样式和属性。
 * fromNode 和 toNode 代表link的两端
 * 每一个{fromNode:nodeBoy, toNode: nodeGirl} 代表一个链接,多个链接就用逗号隔开写多个{...},{...}
*/

// 创建nodeBoy和nodeGirl两个节点之间的一个链接
mydiagram.add(
    GOMAKE(
        go.Link,
        { fromNode: nodeBoy, toNode: nodeGirl },
        GOMAKE(go.Shape)
    )
);
// 用法几乎就是和Node一样
// 一个是go.GraphObject.make.add(节点,节点面板类型,节点外形样式,节点文本样式)
// 一个是go.GraphObject.make.add(链接,链接起止点,节点样式,以及后面会学到的更多的其他配置项)
// 总结:不要把链接当成节点的附属品,虽然链接的确依赖于节点来确定起止点,但除此之外,链接完全独立并拥有自己完整的配置项和节点同等地位的创建方式
重点归纳:LINK是等同于NODE的配置对象,具有和NODE一样独立地位,可以独立创建,拥有完整的属性和样式
通过数据模型创建图表,实现节点外观与节点数据的分离 | Using a Model
<!DOCTYPE html>
<html lang="en">
  <head>
    <meta charset="UTF-8" />
    <meta http-equiv="X-UA-Compatible" content="IE=edge" />
    <meta name="viewport" content="width=device-width, initial-scale=1.0" />
    <script src="https://unpkg.com/gojs/release/go-debug.js"></script>
    <title>Demo</title>
  </head>
  <body>
    <div
      id="chartid"
      style="margin:20px auto; width:90%; height:850px; background-color: #baa4be;"
    ></div>
    <script>
      const GOMAKE = go.GraphObject.make;
      const mydiagram = GOMAKE(go.Diagram, "chartid");
      const nodeData = [{ key: "龙傲天" }, { key: "曲珑珺" }];
      const linkData = [{ from: "龙傲天" }, { to: "曲珑珺" }];
      mydiagram.model = new go.GraphLinksModel(nodeData, linkData);
    </script>
  </body>
</html>
效果如下:

问题:
- 期待的链接没有生成
原因:
- linkData格式写错了,from和to应在同一个{}里
// linkData格式写错了,from和to应在同一个{}里
const nodeData = [{ key: "龙傲天" }, { key: "曲珑珺" }];
const linkData = [{ from: "龙傲天" }, { to: "曲珑珺" }];
改进:
- 更正linkData的数据格式,将from和to写在同一个{}里
const linkData = [{ from: "龙傲天", to: "曲珑珺" }];
验证:

Chapter 2 - Section 2 简单小结:通过数据模型创建图表,实现节点外观与节点数据相分离
// 节点和链接的数据模型基本上只是一个数据集合,其中包含每个节点和每个链接的基本信息。
// 节点数据是一个数组,里面的每一个对象都是一个节点,对象具有基本属性“key”,key是唯一不可重复的值
const nodeData = [{ key: "龙傲天" }, { key: "曲珑珺" }];
// 链接数据也是一个数组,里面的每一个对象都是一个链接,对象具有两个基本属性“from,to”分别指向起止节点的key
const linkData = [{ from: "龙傲天", to: "曲珑珺" }];
// 定义好数据模型后,通过我们新接触到的图表的模型model属性,将数据按照一定规则放进图表里
// 例子中的 go.GraphLinksModel就是图表内置的一种规则,通过new 来调用,并且传如两个数组,分别是节点和链接数据
mydiagram.model = new go.GraphLinksModel(nodeData, linkData);

// 以上就基本实现了节点外观和节点数据的分离
通过数据绑定给节点传参 | Parameterizing Nodes using data binding
上一小结我们通过model实现了节点外观与节点数据的分离,但是仅仅做了最初级的演示,节点没有任何样式,那么我们能不能在model的基础上实现对样式的美化呢,接下来就给大家引入一个新的知识点叫做节点模板(nodeTemplate),通常我们在使用数据模型(model)的时候都会搭配节点模板一起使用。看代码:
<!DOCTYPE html>
<html lang="en">
  <head>
    <meta charset="UTF-8" />
    <meta http-equiv="X-UA-Compatible" content="IE=edge" />
    <meta name="viewport" content="width=device-width, initial-scale=1.0" />
    <script src="https://unpkg.com/gojs/release/go-debug.js"></script>
    <title>Demo</title>
  </head>
  <body>
    <div
      id="chartid"
      style="margin:20px auto; width:90%; height:850px; background-color: #baa4be;"
    ></div>
    <script>
      const GOMAKE = go.GraphObject.make;
      const mydiagram = GOMAKE(go.Diagram, "chartid");
      const boybrush = GOMAKE(go.Brush, "Linear", {
        0.0: "#6161ff",
        1.0: "#fff",
      });
      const girlbrush = GOMAKE(go.Brush, "Linear", {
        0.0: "#f66161",
        1.0: "#fff",
      });
      const nodeData = [{ key: "龙傲天" }, { key: "曲珑珺" }];
      const linkData = [{ from: "龙傲天", to: "曲珑珺" }];
      // 在把数据写入图表之前,我们可以使用nodeTemplate为节点预设样式,这样当数据写入图表的时候生成的节点就自动套用我们预设好的样式了
      mydiagram.nodeTemplate = GOMAKE(
        go.Node,
        "Auto",
        GOMAKE(go.Shape, "Ellipse", { fill: girlbrush }),
        GOMAKE(go.TextBlock, "人名", { margin: 5 })
      );
      mydiagram.model = new go.GraphLinksModel(nodeData, linkData);
    </script>
  </body>
</html>
效果如下:

问题:
- 节点样式是有了,可是我们数据模板中的内容没了(期待显示的是“龙傲天”和“曲珑珺”,而不是两个“人名”)
- 我们预设了两个笔刷(boybrush,girlbrush),在节点模板中却只能使用一个。(期待显示的是“龙傲天”使用boybrush笔刷效果,“曲珑珺”使用girlbrush笔刷效果)
原因:
- 因为我们在定义模板样式的时候把节点文本内容写死了,固定值为“人名”
- 因为我们还不会更多设置,目前只能实现所有节点都应用同一个样式,所以就算定义了很多效果,最终所有节点依旧是单一的一种效果。
改进:
- 引入新知识点Binding,通过数据绑定来 读取每个节点下的数据模型中的数据。在本次演示中,我们希望节点显示的文本为数据中的龙傲天和曲珑珺,也就是说希望node中TextBlock的text读取model中的nodeData的key。上代码:
      mydiagram.nodeTemplate = GOMAKE(
        go.Node,
        "Auto",
        GOMAKE(go.Shape, "Ellipse", { fill: girlbrush }),
        GOMAKE(
          go.TextBlock,
          { margin: 5 },
          // binding to get TextBlock.text from nodedata.key
          // new go.Binding(参数1,参数2)是固定用法
          // 参数1 是TextBlock的属性
          // 参数2是 mydiagram.model = new go.GraphLinksModel(nodeData, linkData) 语句中第一个参数,也就是nodeData中对象的键名。也就是数据模型中存在的属性。
          // 本次演示数据较为单一nodeData = [{ key: "龙傲天" }, { key: "曲珑珺" }]只有key这一个属性。
          // 如果需要绑定多个属性可以多写几个 new go.Binding(参数1,参数2),而不能在一个binding里面写多组参数,如有问题着急解决可以私信交流,手机app能收到消息。
          new go.Binding("text", "key")
        )
      );
      const nodeData = [{ key: "龙傲天" }, { key: "曲珑珺" }];
      const linkData = [{ from: "龙傲天", to: "曲珑珺" }];
      mydiagram.model = new go.GraphLinksModel(nodeData, linkData);
验证:

- 通过binding可以读取到节点绑定的不同数据,那么可以考虑将样式事先匹配进数据中,然后通过binding读取数据实现不同的样式。上代码:
      const boybrush = GOMAKE(go.Brush, "Linear", {
        0.0: "#6161ff",
        1.0: "#fff",
      });
      const girlbrush = GOMAKE(go.Brush, "Linear", {
        0.0: "#f66161",
        1.0: "#fff",
      });
      mydiagram.nodeTemplate = GOMAKE(
        go.Node,
        "Auto",
        GOMAKE(
          go.Shape,
          "Ellipse",
          { fill: "pink" }, // 为fill设置默认值为粉色,避免有的节点没有YYDS属性报错
          new go.Binding("fill", "YYDS") // binding读取数据的YYDS值覆盖节点的fill值
        ),
        GOMAKE(
          go.TextBlock,
          { margin: 5 },
          new go.Binding("text", "key")
        )
      );
      const nodeData = [
        { key: "小丑" },
        { key: "龙傲天", YYDS: boybrush },// 自定义一个属性YYDS存储我们定义好的样式变量
        { key: "曲珑珺", YYDS: girlbrush },// 这一步就是将节点的fill样式提前写进了数据里,在渲染节点的时候,就可以读取每个节点自己的fill属性
      ];
      const linkData = [{ from: "龙傲天", to: "曲珑珺" }];
      mydiagram.model = new go.GraphLinksModel(nodeData, linkData);
验证:


 1818
1818


 被折叠的 条评论
为什么被折叠?
被折叠的 条评论
为什么被折叠?
 到【灌水乐园】发言


