


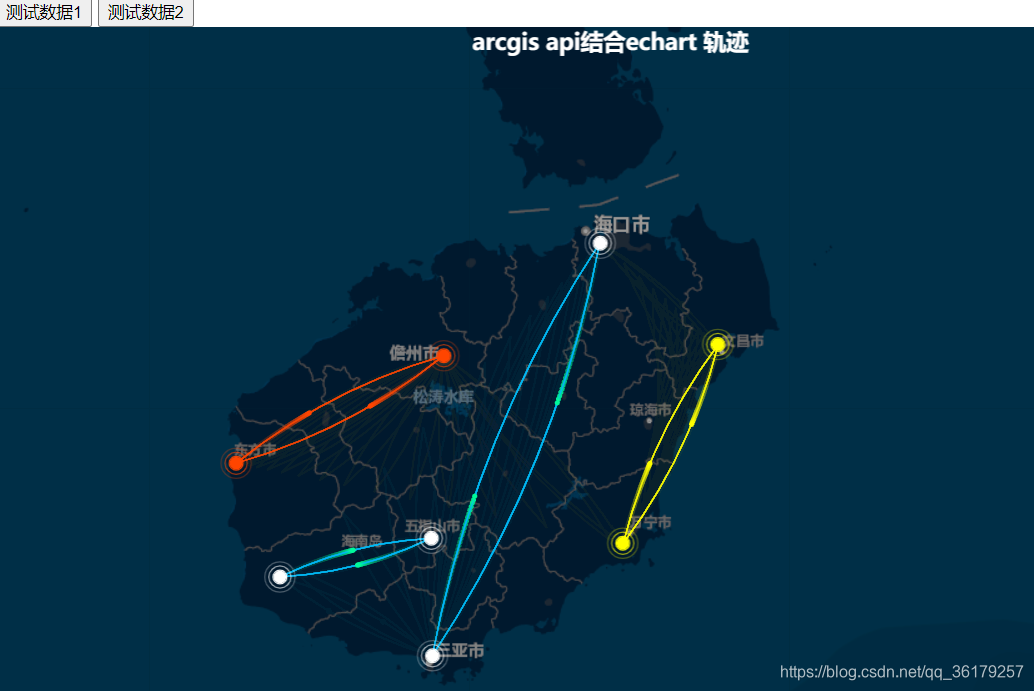
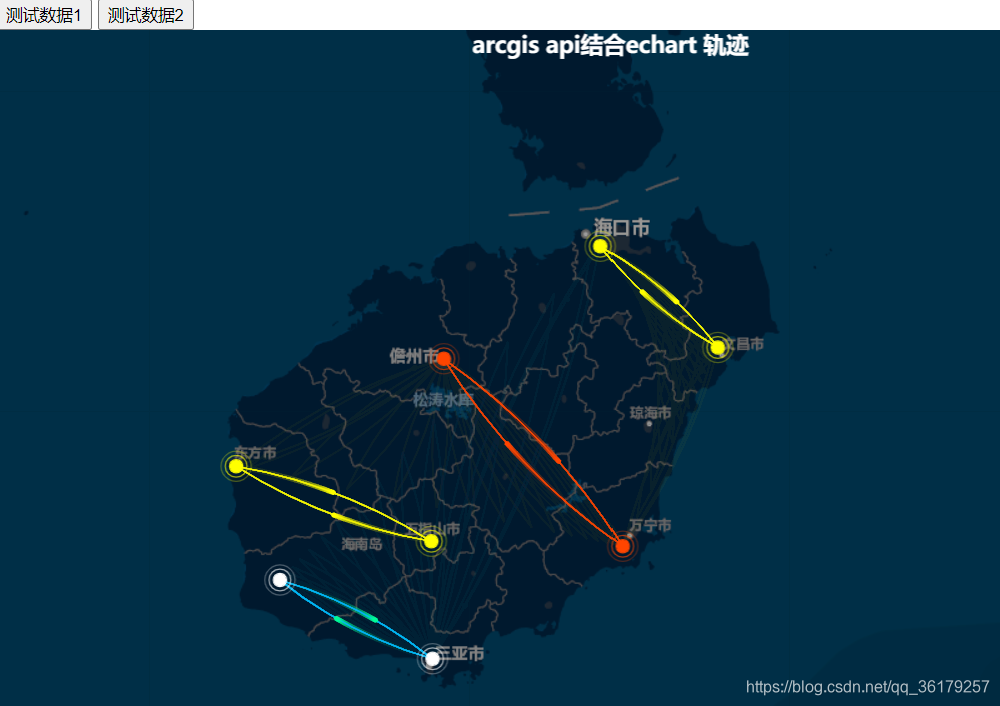
 该示例展示了如何在arcGIS API中结合ECharts库,通过Echarts3Layer.js来创建轨迹渲染效果。代码包括加载地图、设置底图、定义数据结构以及用ECharts绘制不同类型的流向图(正常、告警、故障)和涟漪效果散点。用户可以通过按钮切换两种测试数据,观察轨迹变化。
arcgis api要想加载echarts,需要引入Echarts3Layer.js,官方下载地址:Echarts3Layer.js下载。下载完以后,官方建议配置在js api的目录下,但其实放在本地目录也可以,引用时候注意本地路径就可以。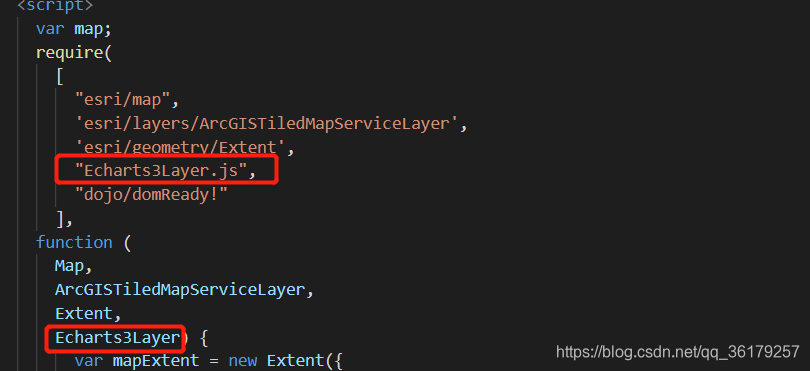
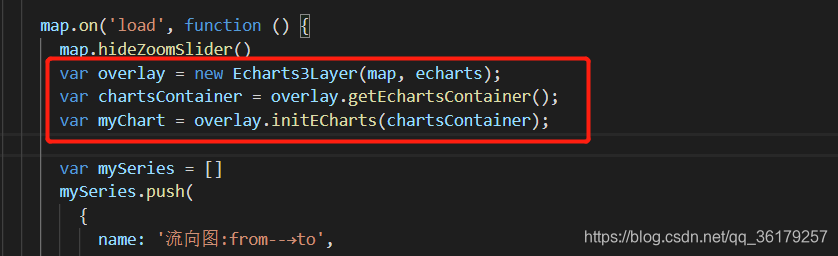
创建实例:
echarts.js和Echarts3Layer.js下载地址: echarts.js和Echarts3Layer.js
底图采用arcgis在线的蓝色午夜版底图,两份测试数据切换渲染效果:
完整代码:
<!DOCTYPE html>
<html>
<head>
  <meta http-equiv="Content-Type" content="text/html; charset=utf-8">
  <meta name="viewport" content="initial-scale=1, maximum-scale=1,user-scalable=no"/>
  <title>arcgis api结合echart 轨迹</title>
  <link rel="stylesheet" href="https://js.arcgis.com/3.34/esri/css/esri.css">
  <style>
    html, body {
      height: 100%;
      width: 100%;
      margin: 0;
      padding: 0;
    }

    #map {
      width: 100%;
      height: 100%;
      margin: 0;
      padding: 0;
      border: 0px dashed black;
      background-color: rgb(0, 38, 48);
    }

  </style>
</head>
<body>
  <input type="button" value="测试数据1" onclick="getData(data1)">
  <input type="button" value="测试数据2" onclick="getData(data2)">
<div id="map"></div>
<script src="echarts.js"></script>
<script src="https://js.arcgis.com/3.34"></script>
<script>
  var map, getData, delList, data1, data2;
  require(
    [
      "esri/map",
      'esri/layers/ArcGISTiledMapServiceLayer',
      'esri/geometry/Extent',
      "Echarts3Layer.js",
      "dojo/domReady!"
    ],
  function (
    Map,
    ArcGISTiledMapServiceLayer,
    Extent,
    Echarts3Layer) {
      var mapExtent = new Extent({
        xmax: 110.34219072728925,
        xmin: 110.26916982794233,
        ymax: 19.039261212140858,
        ymin: 19.000847193662736,
        spatialReference: {
          wkid: 4326
        }
      })
      map = new Map("map", {
        logo: false,
        extent: mapExtent,
        isZoomSlider: false,
        zoom: 8
      });

      //arcgis 在线午夜版底图
      var myTiledMapServiceLayer = new ArcGISTiledMapServiceLayer("http://cache1.arcgisonline.cn/arcgis/rest/services/ChinaOnlineStreetPurplishBlue/MapServer");
      map.addLayer(myTiledMapServiceLayer)

      map.on('load', function () {
        map.hideZoomSlider()
        getData(data1) //默认测试数据1渲染
      })

      //转为float类型
      function toNum(n) {
        return parseFloat(n)
      }

      //测试数据1
      data1 = [
        {"type":"正常","from":"海口","from_lon":110.259516,"from_lat":19.992593,"to":"三亚","to_lon":109.524805,"to_lat":18.278795},
        {"type":"告警","from":"文昌","from_lon":110.776493,"from_lat":19.573909,"to":"琼海","to_lon":110.358393,"to_lat":18.751495},
        {"type":"故障","from":"儋州","from_lon":109.576991,"from_lat":19.527321,"to":"东方","to_lon":108.663752,"to_lat":19.081471},
        {"type":"正常","from":"乐东","from_lon":108.856013,"from_lat":18.610993,"to":"五指山","to_lon":109.522059,"to_lat":18.772301}
      ]
      //测试数据2
      data2 = [
        {"type":"告警","from":"海口","from_lon":110.259516,"from_lat":19.992593,"to":"文昌","to_lon":110.776493,"to_lat":19.573909},
        {"type":"故障","from":"儋州","from_lon":109.57699,"from_lat":19.527321,"to":"琼海","to_lon":110.358393,"to_lat":18.751495},
        {"type":"告警","from":"五指山","from_lon":109.522059,"from_lat":18.772301,"to":"东方","to_lon":108.663752,"to_lat":19.081471},
        {"type":"正常","from":"乐东","from_lon":108.856013,"from_lat":18.610993,"to":"三亚","to_lon":109.524805,"to_lat":18.278795}
      ]

      //场景chart实例
      var overlay = new Echarts3Layer(map, echarts);
      var chartsContainer = overlay.getEchartsContainer();
      var myChart = overlay.initECharts(chartsContainer);

      var zcPoints = []  //正常点集合
      var gjPoints = []  //告警点集合
      var gzPoints = []  //故障点集合
      var zcLineft = []
      var zcLinetf = []
      var gjLineft = []
      var gjLinetf = []
      var gzLineft = []
      var gzLinetf = []

      //各轨迹集合清空
      delList = function() {
        zcPoints.length = 0
        gjPoints.length = 0
        gzPoints.length = 0
        zcLineft.length = 0
        zcLinetf.length = 0
        gjLineft.length = 0
        gjLinetf.length = 0
        gzLineft.length = 0
        gzLinetf.length = 0
      }
      //获取数据渲染轨迹
      getData = function(data) {
        delList() //清空上次渲染数据
        var length = data.length
        if (length > 0) {
          for (var i = 0; i < length; i++) { //获取所有点集合
            var flon = toNum(data[i].from_lon)
            var flat = toNum(data[i].from_lat)
            var fPoint = {"value": [flon, flat]}
            var tlon = toNum(data[i].to_lon)
            var tlat = toNum(data[i].to_lat)
            var tPoint = {"value": [tlon, tlat]}
            var ft = [ //流向线 from至to
              {"coord": [flon, flat]},
              {"coord": [tlon, tlat]}
            ]
            var tf = [ //流向线  to至from
              {"coord": [tlon, tlat]},
              {"coord": [flon, flat]}
            ]
            if (data[i].type == "正常") {
              zcPoints.push(fPoint)
              zcPoints.push(tPoint)
              zcLineft.push(ft)
              zcLinetf.push(tf)
            }
            if (data[i].type == "告警") {
              gjPoints.push(fPoint)
              gjPoints.push(tPoint)
              gjLineft.push(ft)
              gjLinetf.push(tf)
            }
            if (data[i].type == "故障") {
              gzPoints.push(fPoint)
              gzPoints.push(tPoint)
              gzLineft.push(ft)
              gzLinetf.push(tf)
            }
          }
        }


        //配置
        var mySeries = []
        mySeries.push(
          {
            name: '正常流向图:from--→to',
            type: 'lines',
            zlevel: 1,
            effect: {
                "show": true,
                "period": 2, //轨迹速度
                "trailLength": 0.5,//轨迹长度
                "symbol": "pin",
                "symbolSize": 7, //轨迹宽度
                "color": "#00FA9A"  //轨迹颜色 绿色
              },
              lineStyle: {
                normal:
                  {
                    width: 1, //线的宽度
                    color: '#00BFFF', //线的颜色 蓝色
                    opacity: 0.5, // 透明度
                    curveness: 0.1 //线的弧度,值越大,弧度越大
                  }
              },
            data: zcLineft
          },
          {
            name: '正常流向图:to--→from',
            type: 'lines',
            zlevel: 1,
            effect: {
                "show": true,
                "period": 2, //轨迹速度
                "trailLength": 0.5,//轨迹长度
                "symbol": "pin",
                "symbolSize": 7,
                "color": "#00FA9A"
              },
              lineStyle: {
                normal:
                  {
                    width: 1,
                    color: '#00BFFF',
                    opacity: 0.5,
                    curveness: 0.1
                  }
              },
            data: zcLinetf
          },
          {
            name: '告警流向图:from--→to',
            type: 'lines',
            zlevel: 1,
            effect: {
                "show": true,
                "period": 2, //轨迹速度
                "trailLength": 0.5,//轨迹长度
                "symbol": "pin",
                "symbolSize": 7, //轨迹宽度
                "color": "#FFFF00" // 轨迹颜色 黄色
              },
              lineStyle: {
                normal:
                  {
                    width: 1, //线的宽度
                    color: '#FFFF00', //线的颜色 黄色
                    opacity: 0.5, // 透明度
                    curveness: 0.1 //线的弧度,值越大,弧度越大
                  }
              },
            data: gjLineft
          },
          {
            name: '告警流向图:to--→from',
            type: 'lines',
            zlevel: 1,
            effect: {
                "show": true,
                "period": 2, //轨迹速度
                "trailLength": 0.5,//轨迹长度
                "symbol": "pin",
                "symbolSize": 7, //轨迹宽度
                "color": "#FFFF00" // 轨迹颜色 黄色
              },
              lineStyle: {
                normal:
                  {
                    width: 1, //线的宽度
                    color: '#FFFF00', //线的颜色 黄色
                    opacity: 0.5, // 透明度
                    curveness: 0.1 //线的弧度,值越大,弧度越大
                  }
              },
            data: gjLinetf
          },
          {
            name: '故障流向图:from--→to',
            type: 'lines',
            zlevel: 1,
            effect: {
                "show": true,
                "period": 2, //轨迹速度
                "trailLength": 0.5,//轨迹长度
                "symbol": "pin",
                "symbolSize": 7, //轨迹宽度
                "color": "#FF4500" // 轨迹颜色 红色
              },
              lineStyle: {
                normal:
                  {
                    width: 1, //线的宽度
                    color: '#FF4500', //线的颜色 红色
                    opacity: 0.5, // 透明度
                    curveness: 0.1 //线的弧度,值越大,弧度越大
                  }
              },
            data: gzLineft
          },
          {
            name: '故障流向图:to--→from',
            type: 'lines',
            zlevel: 1,
            effect: {
                "show": true,
                "period": 2, //轨迹速度
                "trailLength": 0.5,//轨迹长度
                "symbol": "pin",
                "symbolSize": 7, //轨迹宽度
                "color": "#FF4500" // 轨迹颜色 红色
              },
              lineStyle: {
                normal:
                  {
                    width: 1, //线的宽度
                    color: '#FF4500', //线的颜色 红色
                    opacity: 0.5, // 透明度
                    curveness: 0.1 //线的弧度,值越大,弧度越大
                  }
              },
            data: gzLinetf
          },
          {
            name: '正常:涟漪效果散点',
            type: 'effectScatter',
            coordinateSystem: 'geo',
            zlevel: 2,
            rippleEffect: {
              "period": 2,
              "brushType": "stroke",
              "scale": 3
            },
            symbolSize: 6,
            symbolSize: 10,
            itemStyle: {
              normal: {
                color: '#FFFFFF' //涟漪点颜色  白色
              }
            },
            data: zcPoints
          },
          {
            name: '告警:涟漪效果散点',
            type: 'effectScatter',
            coordinateSystem: 'geo',
            zlevel: 2,
            rippleEffect: {
              "period": 2,
              "brushType": "stroke",
              "scale": 3
            },
            symbolSize: 6,
            symbolSize: 10,
            itemStyle: {
              normal: {
                color: '#FFFF00' //涟漪点颜色  黄色
              }
            },
            data: gjPoints
          },
          {
            name: '故障:涟漪效果散点',
            type: 'effectScatter',
            coordinateSystem: 'geo',
            zlevel: 2,
            rippleEffect: {
              "period": 2,
              "brushType": "stroke",
              "scale": 3
            },
            symbolSize: 6,
            symbolSize: 10,
            itemStyle: {
              normal: {
                color: '#FF4500' //涟漪点颜色  红色
              }
            },
            data: gzPoints
          }
        );

        var option = {
          title: {
            text: 'arcgis api结合echart 轨迹',
            subtext: '',
            left: 'center',
            textStyle: {
              color: '#fff'
            }
          },
          geo: {
            map: '',
            label: {
              emphasis: {
                show: false
              }
            },
            roam: true,
            itemStyle: {
              normal: {
                areaColor: '#323c48',
                borderCOlor: '#404a59'
              },
              emphasis: {
                areaColor: '#2a333d'
              }
            }
          },
          series: mySeries
        }
        myChart.setOption(option)
      }
    });
</script>
</body>
</html>


 1724
1724

 被折叠的 条评论
为什么被折叠?
被折叠的 条评论
为什么被折叠?
 到【灌水乐园】发言


