


 本文介绍如何使用R语言的ggplot2包绘制不同物种的萼片长度与宽度的关系图,并通过添加拟合直线、拟合函数及R²值来增强图表的信息量。此外,还介绍了如何自定义位置添加文本标签以避免与数据点重叠。
R语言绘图,分组添加拟合直线,并标注拟合函数和R2,实现分面后的数据单独自由的标注
#查看数据
head(iris)
str(iris)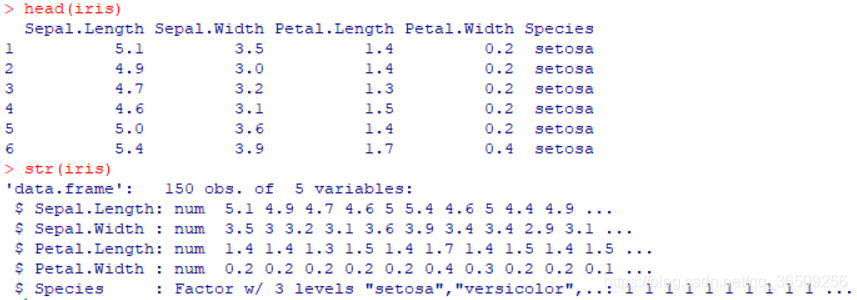
对不同物种(Species)的萼片长度(Sepal. Length)与宽度(Sepal. Width)作
#加载包
library(ggplot2)
#绘图
ggplot(iris,aes(Sepal.Width,Sepal.Length))+
geom_point()+
stat_smooth(method=lm, level=0.99)+
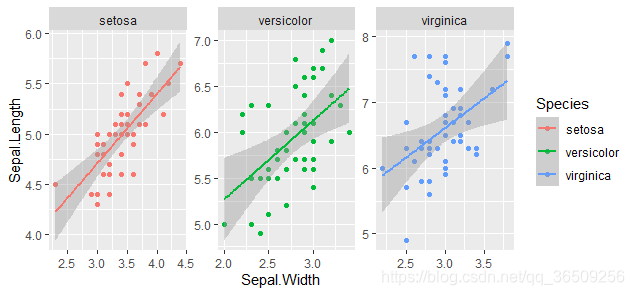
#facet_wrap(~Species)#不同物种进行分面,共用一个y轴
facet_wrap(~Species,scales="free")#不同物种进行分面,scales="free"坐标轴独立自由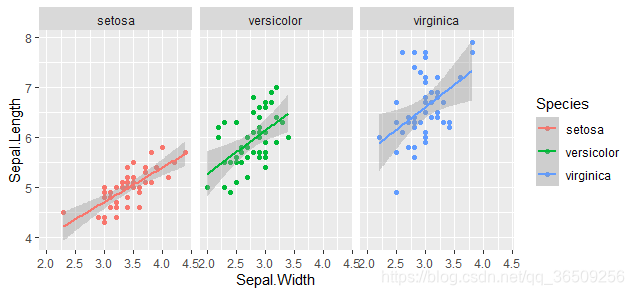
#加载包
library(ggpmisc)
#绘图
#加入拟合函数和R2
ggplot(iris,aes(Sepal.Width,Sepal.Length,color=Species))+
geom_point()+
stat_smooth(method=lm, level=0.99)+
facet_wrap(~Species,scales="free")+
stat_poly_eq(
    aes(label =paste(..eq.label.., ..adj.rr.label.., sep = '~~')),
    formula = y ~ x,  parse = TRUE,
      family="serif",
      size = 3.6,
      color="black",
      label.x = 0.1,  #0-1之间的比例确定位置
      label.y = 1)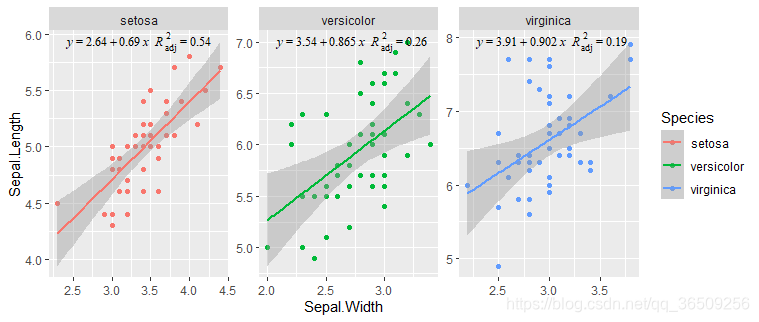
我们发现拟合公式与数据点之间有重叠,想自己在随意为之上加拟合公式的标注
#设定标注的文本
data_text<-data.frame(label=c(1,2,3),
Species=c("setosa","versicolor","virginica"),
x=c(2.5,2.5,2.2),y =c(5.8,6.8,7.5))#确定每个分面(Species)内文字(label)的位置(x,y)
#为每个分面自由添加文字
ggplot(iris,aes(Sepal.Width,Sepal.Length,color=Species))+
geom_point()+
stat_smooth(method=lm, level=0.99)+
facet_wrap(~Species,scales="free")+
geom_text(data=data_text,mapping=aes(x=x,y=y,label=label),nudge_x=0.1,nudge_y=0.1,color="purple")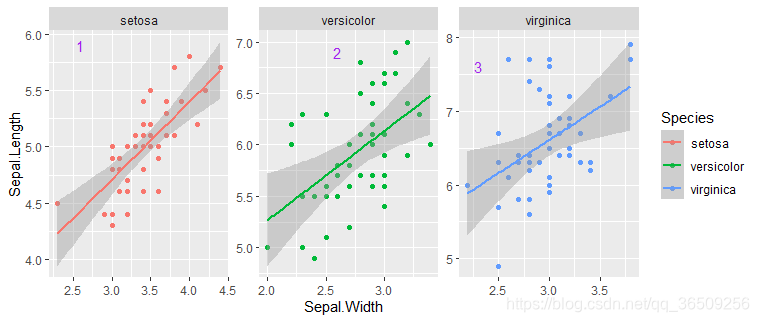
划重点:为什么我用1,2,3代替的公式,因为我不会同时输入:,求走过路过的大佬赐教,我expression没弄明白。


 382
382

 被折叠的 条评论
为什么被折叠?
被折叠的 条评论
为什么被折叠?
 到【灌水乐园】发言


