


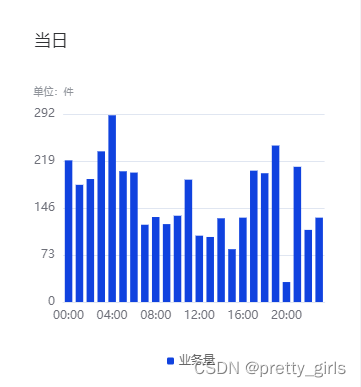
柱状图篇
1、实现x轴时间均匀分布:
xAxis有 interval 属性,按照指定的间隔数字进行分布
export const xAxis = function (data, xAxisConfig) {
  	let interval = Math.ceil(data.length / 7)
  	// 自定义x轴的数字显示
	let axisLabel = {
     interval: function (index, value) {
       return (index) % 4 === 0
     }
   }
	// 指定间隔数字
	// let axisLabel = {
    // 	   interval: 3
    // }

  return {
    type: 'category',
    data,
    axisTick: false,
    axisLabel,
    axisLine: {
      show: true,
      lineStyle: {
        color: '',
      },
    },
  }
}
2、x轴超出的可左右滑动 (dataZoom)
思路是固定双指缩放,固定屏幕x轴展示的数据个数
// 左右滚动,禁止缩放
export const getDataZoom = function () {
  return [
    {
      id: 'dataZoomX',
      type: 'inside',
      rangeMode: ['value'],
      zoomLock: true,
      startValue: '0%',
      endValue: 5,
      minValueSpan: 5,
      maxValueSpan: 5,
    },
  ]
}

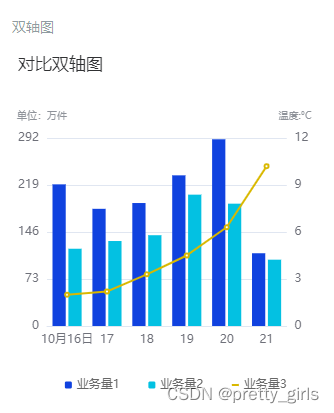
3、对比双轴图
(1)Y轴左右各一条,但是分割线需要对齐重合
export const yAxis = function (data, yConfig = [], type = 'single-column') {

  const lineArr = data.filter(item => item.type === 'line')
  return yConfig.map((item, index) => {
    const arr = index === 1 ? lineArr.length ? lineArr[0].data : [] :
     data.reduce((pre, next) => {
      if (next.type == 'bar') {
        return pre.concat(next.data)
      }
      return pre
    }, [])

    return {
      name: item.name,
      nameLocation: 'end',
      nameTextStyle: {
        color: '#8F939A',
        fontStyle: 'PingFangSC-Regular, PingFang SC',
        fontWeight: 400,
        fontSize: 12,
        lineHeight: 33,
        padding: index === 0 ? type === 'single-column' ? [0, 0, -10, -19] :
        [0, 0, -10, -10] : [0, -17, -10, 0] // 上右下左与原位置距离
      },
      type: 'value',
      splitNumber: 4,
      interval: Math.ceil(Math.max.apply(null, arr) / 4),
      min: 0,
      max: Math.ceil(Math.max.apply(null, arr) / 4) * 4,
      offset: 0,
    }
  })
}
(2)自定义legend的样式,因为折线的样式不同
export const legend = function (data) {
  const color = ['#1042DF', '#03C1E2']
  let i = 0;
  return data.map((item) => {
    const { name, type = 'bar' } = item
    return {
      id: name,
      right: data.length > 2 ? `${65 - i * 25}%` :
      data.length > 1 ? `${50 - i * 25}%` : 'center',
      bottom: 30,
      itemWidth: 7,
      icon: 'roundRect',
      itemHeight: type === 'line' ? 2 : 7,
      // 超出的文字用...
      formatter(name) {
        return name.length > 5 ? name.slice(0, 5) + '...' : name
      },
      data: [{
        name,
        textStyle: {
          color: '#666666',
        },
        itemStyle: {
          color: type === 'line' ? '#D9B800' : color[i++],
        },
      }]
    }
  })

}
(3)legend的点击事件可以取消或者显示对应的图形,现在需要对其进行拦截,当数据类型超过三个才可以隐藏

   const chartDom: any = document.getElementById(props.id)
   const myChart: any = echarts.init(chartDom, undefined, {
     width,
     height,
     renderer: 'svg'
   })
   echartsConfig && myChart.setOption(echartsConfig)
   // 禁止取消图例
    myChart.on('legendselectchanged', function (params: any) {
      let len = myChart.getOption().series.length
      if (len < 4) {

      // 这是legend是上面数组的情况下:
        const legend: any = myChart.getOption().legend;
        legend.forEach((item: any) => {
          item.selected[params.name] = true
        })
        myChart.setOption({
          legend
        })

        // legend 是对象 的情况下:
         myChart.setOption({
            legend: { selected: { [params.name]: true } }
          })
      }
  })
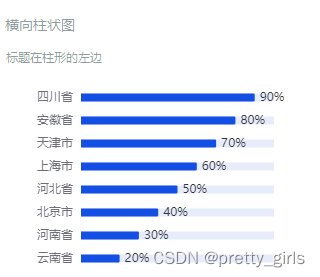
4、横向柱状图
(1)控制整个echart图的左右边距
export const grid = function () {
  return {
    left: 36,
    right: 60,
    top: 20,
    bottom: 0,
    containLabel: true
  }
}
(2)数据超出部分上下滚动
export const getDataZoom = function () {
    return [{
      "type": "inside",
      "showDetail": false,
      "show": false,
      zoomLock: true,
      "yAxisIndex": [0],
      "startValue": 0,
      "endValue": 7,
      "handleSize": 8,
    }]
 }


 463
463


 被折叠的 条评论
为什么被折叠?
被折叠的 条评论
为什么被折叠?
 到【灌水乐园】发言


