


在移动H5使用了 ECharts 开发可视化图表,遇到一个特殊需求:折线趋势图中需要默认展示最后一个坐标轴对应的数据,也就是主动触发 tooltip 的展示。
 一、组件解释说明
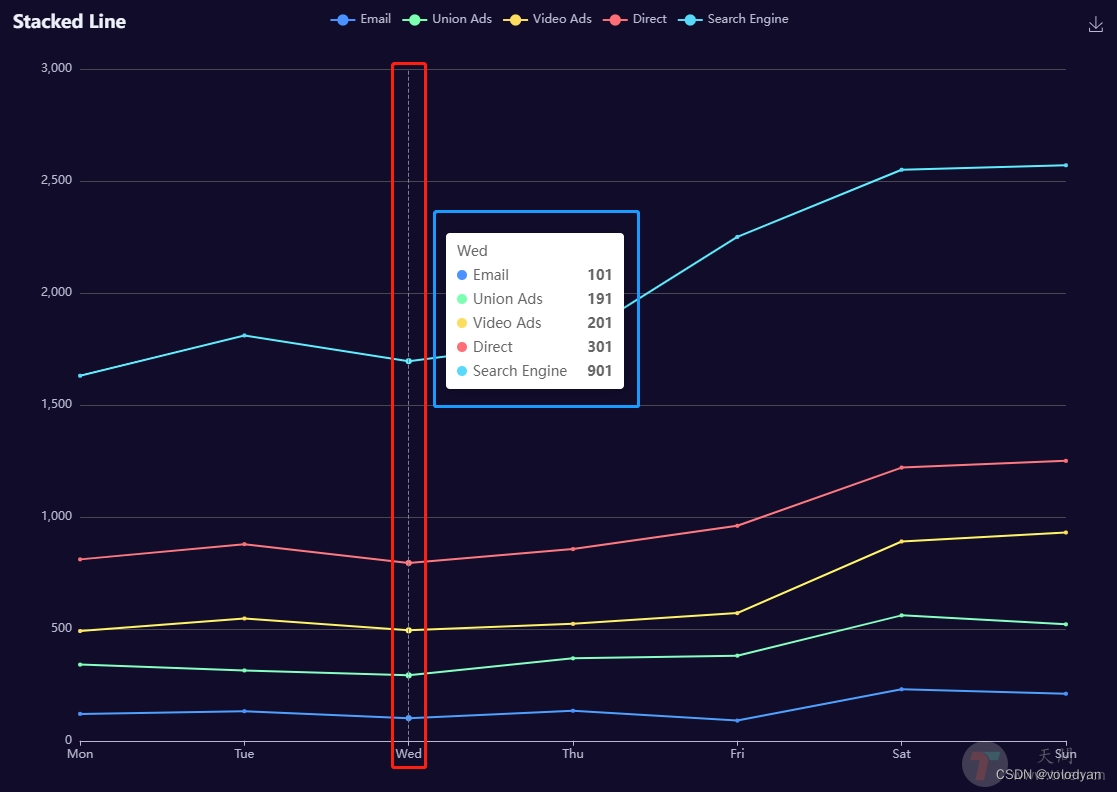
- axisPointer 是坐标轴指示器,上图 红框 中展示部分。
- tooltip 是提示框组件,上图 蓝框 中展示部分。
二、ECharts API
1.echartsInstance.dispatchAction: 触发图表行为,例如图例开关 legendToggleSelect, 数据区域缩放 dataZoom,显示提示框 showTip 等等
2.action.tooltip: 提示框组件相关的行为。
showTip: 显示提示框。
hideTip: 隐藏提示框。
3.action.axisPointer: 坐标轴指示器配置项相关的行为。
updateAxisPointer: 更新坐标轴指示器。
API使用说明:
// showTip 展示 tooltip
dispatchAction({
    type: 'showTip',
    // 系列的 index,在 tooltip 的 trigger 为 axis 的时候可选。
    seriesIndex?: number,
    // 数据项的 index,如果不指定也可以通过 name 属性根据名称指定数据项
    dataIndex?: number,
    // 可选,数据项名称,在有 dataIndex 的时候忽略
    name?: string,
    // 本次显示 tooltip 的位置。只在本次 action 中生效。
    // 缺省则使用 option 中定义的 tooltip 位置。
    position: number[] | string | Function,
});

// hideTip 隐藏 tooltip
dispatchAction({
    type: 'hideTip'
});
三、使用示例
在 Vue 项目中使用:
export default {
  data() {
    return {
      lastIndex: 0,
    }
  },
  methods: {
    // 主动触发展示 tooltip 提示框
    showTip() {
      this.chartInstance.dispatchAction({
        type: 'showTip',
        seriesIndex: 0,
        dataIndex: this.lastIndex,
      });
    },
    // 重新渲染后隐藏 tooltip 和 axisPointer
    hide() {
      // 隐藏 tooltip
      this.chartInstance.dispatchAction({ type: 'hideTip' });
      // 隐藏 axisPointer
      this.chartInstance.dispatchAction({
        type: 'updateAxisPointer',
        currTrigger: 'leave',
      });
    },
  }
}


 1707
1707


 被折叠的 条评论
为什么被折叠?
被折叠的 条评论
为什么被折叠?
 到【灌水乐园】发言


