


使用决策树执行分类
函数功能:对一个测试实例进行分类
参数说明:
inputTree:已经生成的决策树
labels:存储选择的最优特征标签
testVec:测试数据列表,顺序对应原数据集
返回:
classLabel:分类结果
def  classify(inputTree,labels,  testVec):
   firstStr  =  next(iter(inputTree))                      #获取决策树第一个节点
   secondDict  =  inputTree[firstStr]                     #下一个字典
   featIndex  =  labels.index(firstStr)      	   #第一个节点所在列的索引
   for  key  in  secondDict.keys():
         if  testVec[featIndex]  ==  key:
               if  type(secondDict[key])  ==  dict  :
                     classLabel  =  classify(secondDict[key],  labels,  testVec)
               else:
                     classLabel  =  secondDict[key]
   return  classLabel
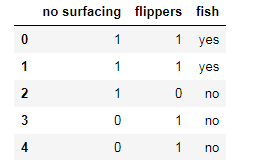
创建列表
labels = list(dataSet.columns)
列表内容:[‘no surfacing’, ‘flippers’, ‘fish’]
调用函数创建树函数
inputTree = myTree
{‘no surfacing’: {0: ‘no’, 1: {‘flippers’: {0: ‘no’, 1: ‘yes’}}}}
firstStr = next(iter(inputTree))
‘no surfacing’
secondDict = inputTree[firstStr]
{0: ‘no’, 1: {‘flippers’: {0: ‘no’, 1: ‘yes’}}}
定义预测函数对测试集进行预测
函数功能:对测试集进行预测,并返回预测后的结果
参数说明:
train:训练集
test:测试集
返回:
test:预测好分类的测试集
def acc_classify(train,test):
inputTree = createTree(train) #根据测试集生成一棵树
labels = list(train.columns) #数据集所有的列名称
result = []
for i in range(test.shape[0]): #对测试集中每一条数据进行循环
testVec = test.iloc[i,:-1] #测试集中的一个实例
classLabel = classify(inputTree,labels,testVec) #预测该实例的分类
result.append(classLabel) #将分类结果追加到result列表中
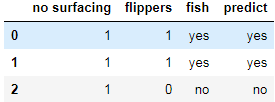
test['predict']=result #将预测结果追加到测试集最后一列
acc = (test.iloc[:,-1]==test.iloc[:,-2]).mean() #计算准确率
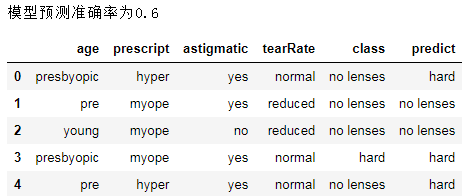
print(f'模型预测准确率为{acc}')
return test
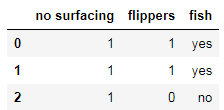
train = dataSet
test = dataSet.iloc[:3,:]
train
test
acc_classify(train,test)
模型预测准确率为1.0
给图形增加标签和颜色
dot_data = tree.export_graphviz(clf, out_file=None,
                               feature_names=['no surfacing', 'flippers'],
                               class_names=['fish', 'not fish'],
                               filled=True, rounded=True,
                               special_characters=True)
graphviz.Source(dot_data)
#利用render方法生成图形
graph = graphviz.Source(dot_data)
graph.render("fish")    #会生成一个fish.pdf文件,显示决策树形
获取叶子节点
def getNumLeafs(myTree):
   numLeafs = 0 #初始化叶节点数目
   firstStr = next(iter(myTree)) #获得树的第一个键值,即第一个特征
   secondDict = myTree[firstStr] #获取下一组字典
   for key in secondDict.keys():
       if type(secondDict[key]) == dict: #测试该节点是否为字典
           numLeafs += getNumLeafs(secondDict[key]) #是字典,递归,循环计算新分支叶节点数
       else:
           numLeafs +=1 #不是字典,代表此结点为叶子结点
   return numLeafs

firstStr = next(iter(myTree))    #结果为'no surfacing'
getNumLeafs(myTree)    #结果为3

def getTreeDepth(myTree):
   maxDepth = 0
   firstStr = next(iter(myTree))
   secondDict = myTree[firstStr]
   for key in secondDict.keys():
       if type(secondDict[key]) == dict:
           thisDepth = 1+getTreeDepth(secondDict[key])
       else:
           thisDepth = 1
       if thisDepth>maxDepth:
           maxDepth = thisDepth
return maxDepth
getTreeDepth(myTree)   #结果为2
“”"
绘制节点
参数说明:
nodeTxt:节点名
centerPt:文本位置
parentPt:标注的箭头位置
nodeType:节点格式
def plotNode(nodeTxt, cntrPt, parentPt, nodeType):
   arrow_args = dict(arrowstyle="<-") #定义箭头格式
   createPlot.ax1.annotate(nodeTxt,
                           xy=parentPt,xycoords='axes fraction',
                           xytext=cntrPt, textcoords='axes fraction',
                           va="center", ha="center",
                           bbox=nodeType,
                           arrowprops=arrow_args)
标注有向边属性值
参数说明:
cntrPt、parentPt:用于计算标注位置
txtString:标注的内容
def plotMidText(cntrPt, parentPt, txtString):
   xMid = (parentPt[0]-cntrPt[0])/2.0 + cntrPt[0] #计算标注位置的横坐标
   yMid = (parentPt[1]-cntrPt[1])/2.0 + cntrPt[1] #计算标注位置的纵坐标
   createPlot.ax1.text(xMid, yMid, txtString, va="center", ha="center", rotation=0)
绘制决策树
参数说明:
myTree:决策树(字典)
parentPt:标注的内容
nodeTxt:节点名
def plotTree(myTree, parentPt, nodeTxt):
   decisionNode = dict(boxstyle="sawtooth", fc="0.8") #设置中间节点格式
   leafNode = dict(boxstyle="round4", fc="0.8") #设置叶节点格式
   numLeafs = getNumLeafs(myTree) #获取决策树叶结点数目,决定了树的宽度
   depth = getTreeDepth(myTree) #获取决策树层数
   firstStr = next(iter(myTree)) #下个字典
   cntrPt = (plotTree.xOff+(1.0+float(numLeafs))/2.0/plotTree.totalW,plotTree.yOff)#确定中心位置
   plotMidText(cntrPt, parentPt, nodeTxt) #标注有向边属性值
   plotNode(firstStr, cntrPt, parentPt, decisionNode) #绘制节点
   secondDict = myTree[firstStr] #下一个字典,也就是继续绘制子结点
   plotTree.yOff = plotTree.yOff - 1.0/plotTree.totalD #y偏移
   for key in secondDict.keys():
       if type(secondDict[key])== dict: #测试该结点是否为字典
           plotTree(secondDict[key],cntrPt,str(key)) #是字典则不是叶结点,递归调用继续绘制
       else:
           plotTree.xOff = plotTree.xOff + 1.0/plotTree.totalW #x偏移
           plotNode(secondDict[key], (plotTree.xOff, plotTree.yOff), cntrPt, leafNode)
           plotMidText((plotTree.xOff, plotTree.yOff), cntrPt, str(key))
   plotTree.yOff = plotTree.yOff + 1.0/plotTree.totalD
创建绘制面板
参数说明:
inTree:决策树(字典)
def createPlot(inTree):
   fig = plt.figure(1, facecolor='white') #创建fig
   fig.clf() #清空fig
   axprops = dict(xticks=[], yticks=[])
   createPlot.ax1 = plt.subplot(111, frameon=False, **axprops) #去掉x、y轴
   plotTree.totalW = float(getNumLeafs(inTree)) #获取决策树叶结点数目
   plotTree.totalD = float(getTreeDepth(inTree)) #获取决策树深度
   plotTree.xOff = -0.5/plotTree.totalW #x偏移的初始值
   plotTree.yOff = 1.0 #y偏移的初始值
   plotTree(inTree, (0.5,1.0), '') #绘制决策树
   plt.show() #显示绘制结果
导入Matplotlib包,对决策树进行绘图
import random
import matplotlib.pyplot as plt
%matplotlib inline
plt.rcParams['font.sans-serif']=['SimHei'] #用来正常显示中文
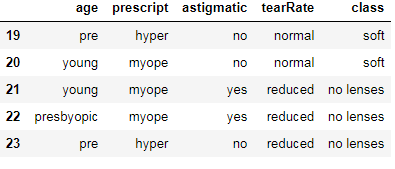
lenses = pd.read_table('lenses.txt',header = None)
lenses.columns =['age','prescript','astigmatic','tearRate','class']
lenses

切分训练集和测试集
参数说明:
dataSet:输入的数据集
rate:训练集所占比例
返回:
train,test:切分好的训练集和测试集
def randSplit(dataSet, rate):
   l = list(dataSet.index) #提取出索引
   random.shuffle(l) #随机打乱索引
   dataSet.index = l #将打乱后的索引重新赋值给原数据集
   n = dataSet.shape[0] #总行数
   m = int(n * rate) #训练集的数量
   train = dataSet.loc[range(m), :] #提取前m个记录作为训练集
   test = dataSet.loc[range(m, n), :] #剩下的作为测试集
   dataSet.index = range(dataSet.shape[0]) #更新原数据集的索引
   test.index = range(test.shape[0]) #更新测试集的索引
return train, test
dataSet = lenses
l = list(dataSet.index)
l: [0, 1, 2,…… 23]
random.shuffle(l)
dataSet.index = l

rate =0.8
n = dataSet.shape[0] #总行数    24
m = int(n * rate) #训练集的数量   19
train = dataSet.loc[range(m), :]

#剩下的作为测试集
test = dataSet.loc[range(m, n), :]
train1,test1 = randSplit(lenses, 0.8)

#利用训练集生成决策树
lensesTree = createTree(train1)
lensesTree
{‘tearRate’: {‘normal’: {‘astigmatic’: {‘no’: {‘age’: {‘pre’: ‘soft’, ‘presbyopic’: {‘prescript’: {‘hyper’: ‘soft’, ‘myope’: ‘no lenses’}}, ‘young’: ‘soft’}}, ‘yes’: ‘hard’}}, ‘reduced’: ‘no lenses’}}
#构造注解树
createPlot(lensesTree)

#用决策树进行分类并计算有预测准确率
acc_classify(train1,test1)
Xtrain1 = train1.iloc[:,:-1]

Xtrain1['age'].value_counts()
young 7
pre 6
presbyopic 6
Name: age, dtype: int64
labels = Xtrain1['age'].unique().tolist()
[‘pre’, ‘presbyopic’, ‘young’]
Xtrain1['age']= Xtrain1['age'].apply(lambda x: labels.index(x))
for i in Xtrain1.columns:
    labels = Xtrain1[i].unique().tolist()
    Xtrain1[i]= Xtrain1[i].apply(lambda x: labels.index(x))
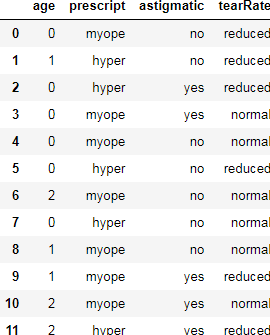
#特征列
Xtrain1 = train1.iloc[:,:-1]
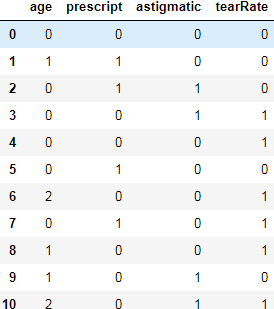
for i in Xtrain1.columns:
labels = Xtrain1[i].unique().tolist()
Xtrain1[i]= Xtrain1[i].apply(lambda x: labels.index(x))
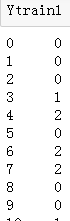
#标签列
Ytrain1 = train1.iloc[:,-1]
labels = Ytrain1.unique().tolist()
Ytrain1= Ytrain1.apply(lambda x: labels.index(x))
#绘制树形图
clf = DecisionTreeClassifier()
clf = clf.fit(Xtrain1, Ytrain1)
tree.export_graphviz(clf)
dot_data = tree.export_graphviz(clf, out_file=None)
graphviz.Source(dot_data)

#添加标签和颜色
dot_data = tree.export_graphviz(clf, out_file=None,
                                feature_names=['age', 'prescript', 'astigmatic','tearRate'],
                                class_names=['soft','hard','no lenses'],
                                filled=True, rounded=True,special_characters=True)
graphviz.Source(dot_data)

#使用render存储树形图
graph = graphviz.Source(dot_data)
graph.render("lense")
得到决策树图形文件’lense.pdf’


 131
131


 被折叠的 条评论
为什么被折叠?
被折叠的 条评论
为什么被折叠?
 到【灌水乐园】发言


