


 本文介绍了如何在Prometheus中设置HTTP基本身份验证,包括生成加密哈希,配置认证文件,通过Docker重启容器并添加参数,以及使用cURL进行访问测试。此外,还提及了Grafana数据源的配置与服务的热加载功能。
前提环境:
- Prometheus
- Grafana
涉及参考文档:
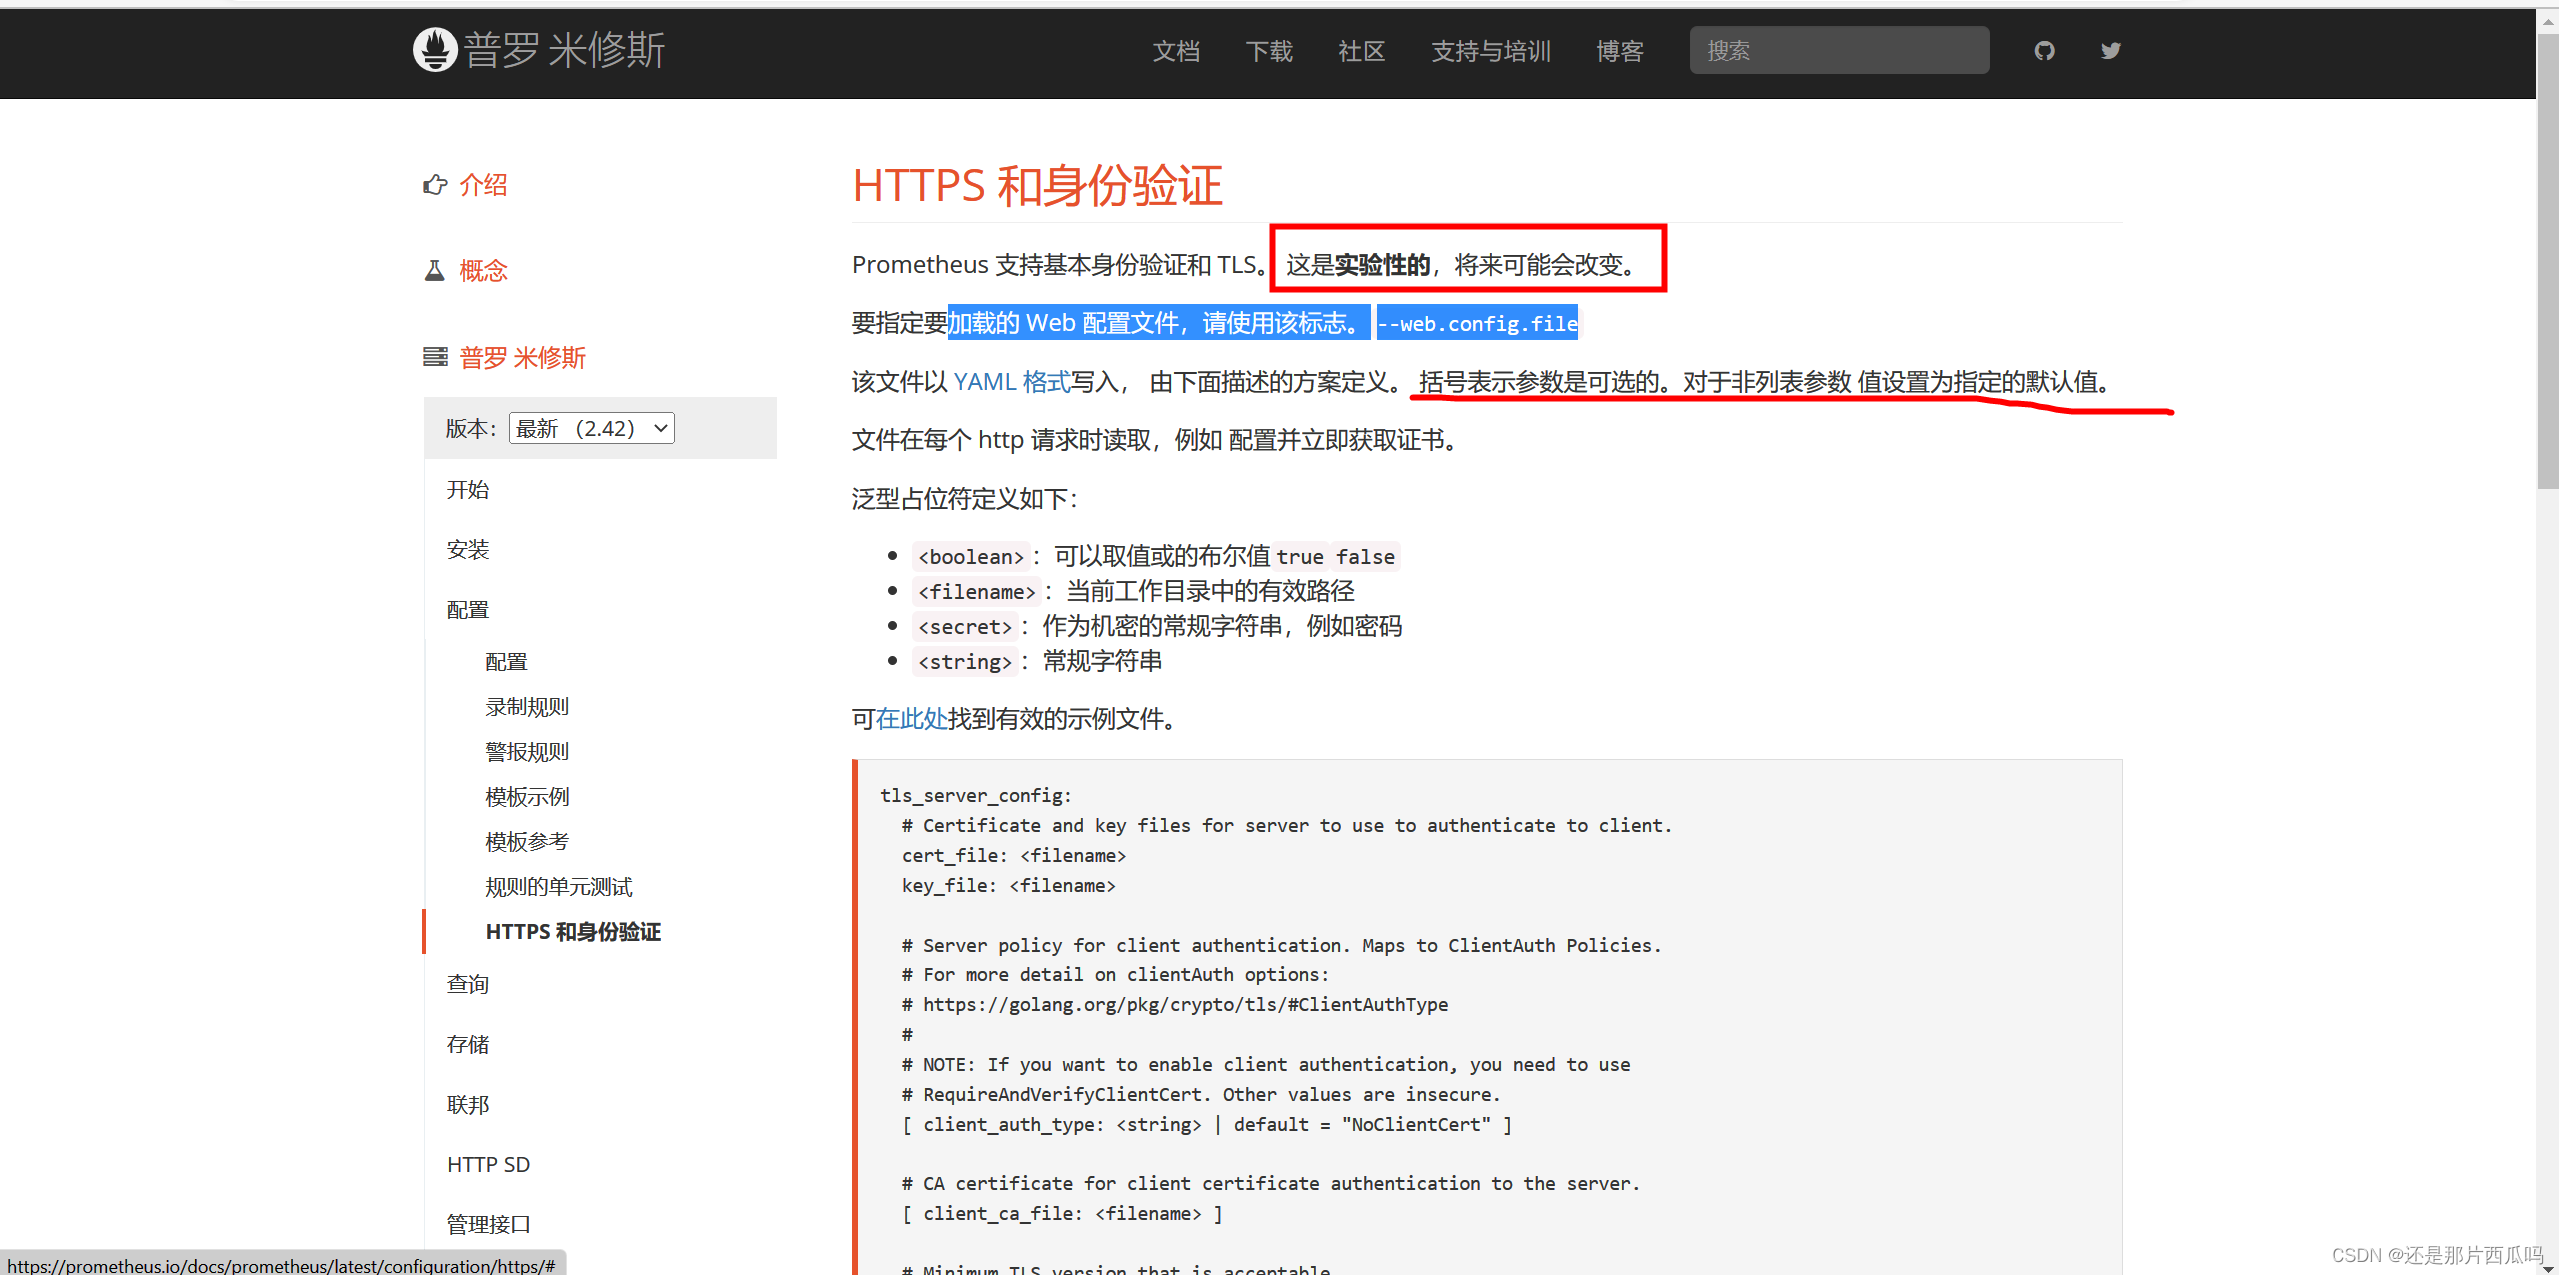
加载的 Web 配置文件,请使用该参数·。--web.config.file
一、生成加密哈希
1、 安装 httpd-tools 加密工具
yum install -y httpd-tools
2、自定义密码
htpasswd -nBC 12 '' | tr -d ':\n'

二、配置认证文件
basic_auth_users:
    admin: $2y$12$1807mv67DEse0l/jRXIHl.aytvO7bfellsEUZNfxIgH0ivQWqsqae
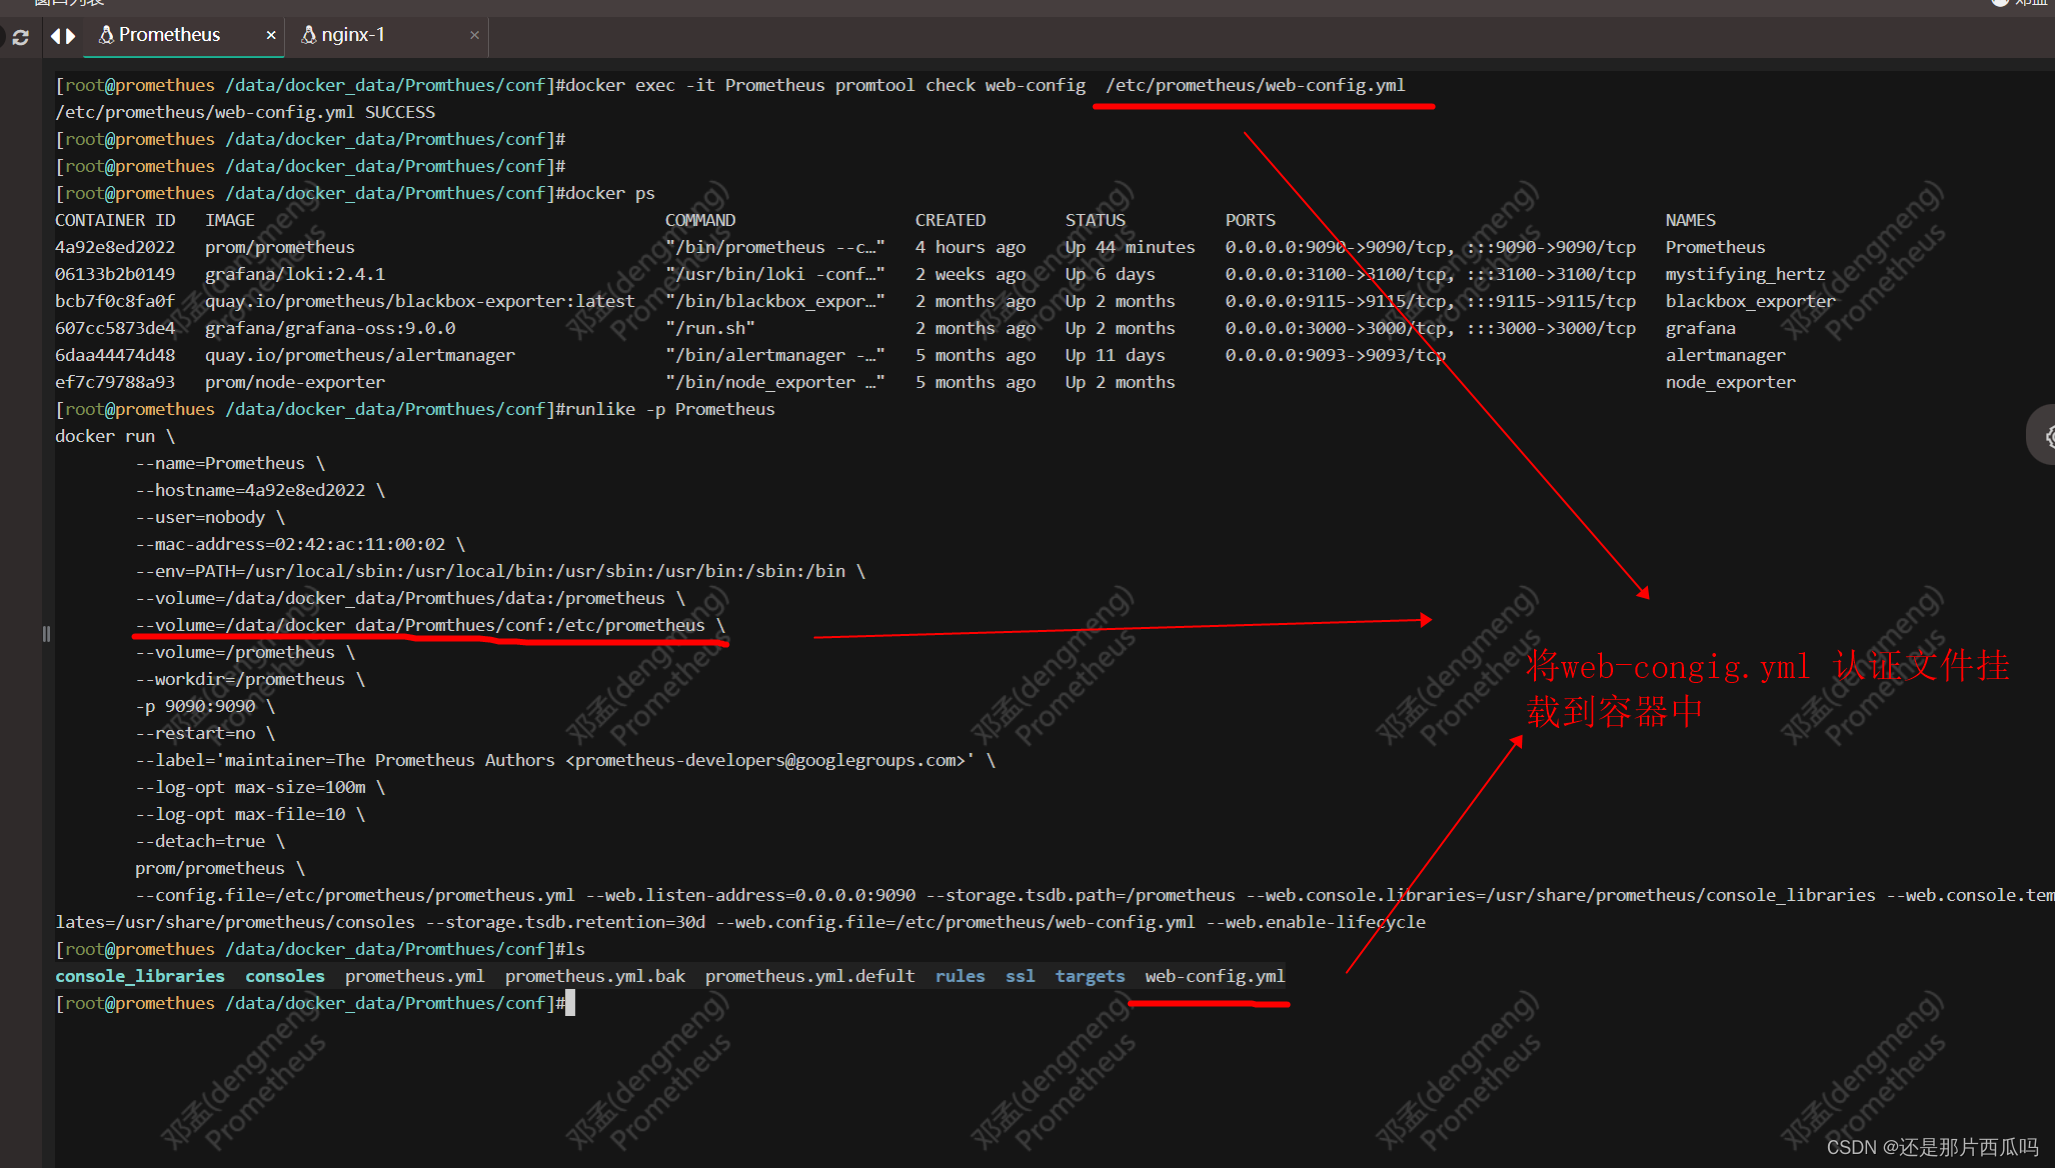
三、重启新Prometheus容器
新增参数: --web.config.file=认证文件名称
docker run --name Prometheus -d \
-v /data/docker_data/Promthues/data:/prometheus \
-v /data/docker_data/Promthues/conf:/etc/prometheus \
-p 9090:9090 prom/prometheus \
--config.file=/etc/prometheus/prometheus.yml \
--web.listen-address="0.0.0.0:9090" \
--storage.tsdb.path=/prometheus \
--web.console.libraries=/usr/share/prometheus/console_libraries \
--web.console.templates=/usr/share/prometheus/consoles \
--storage.tsdb.retention=30d \
--web.config.file=/etc/prometheus/web-config.yml \
--web.enable-lifecycle
注:
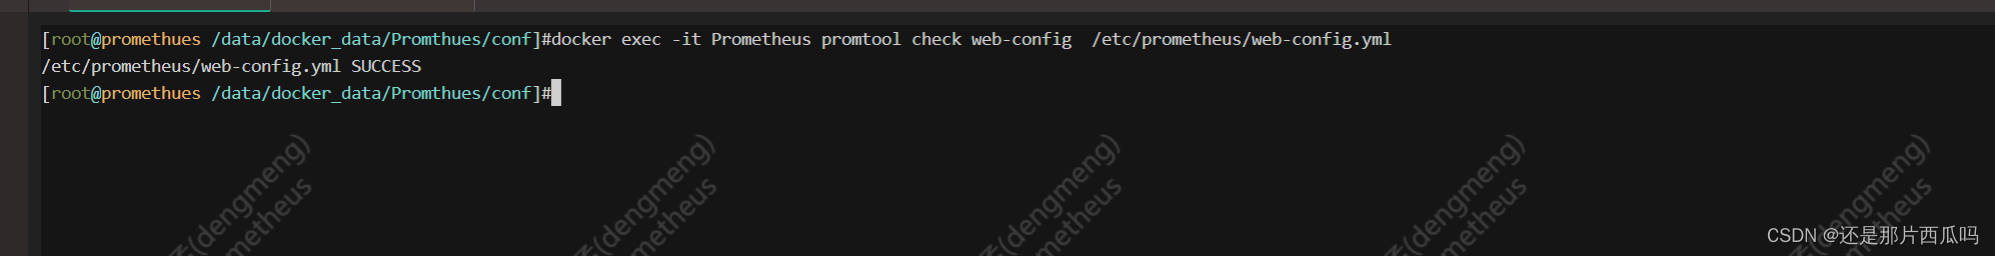
验证文件是否符合要求 语法
promtool check web-config web.yml
四、访问测试
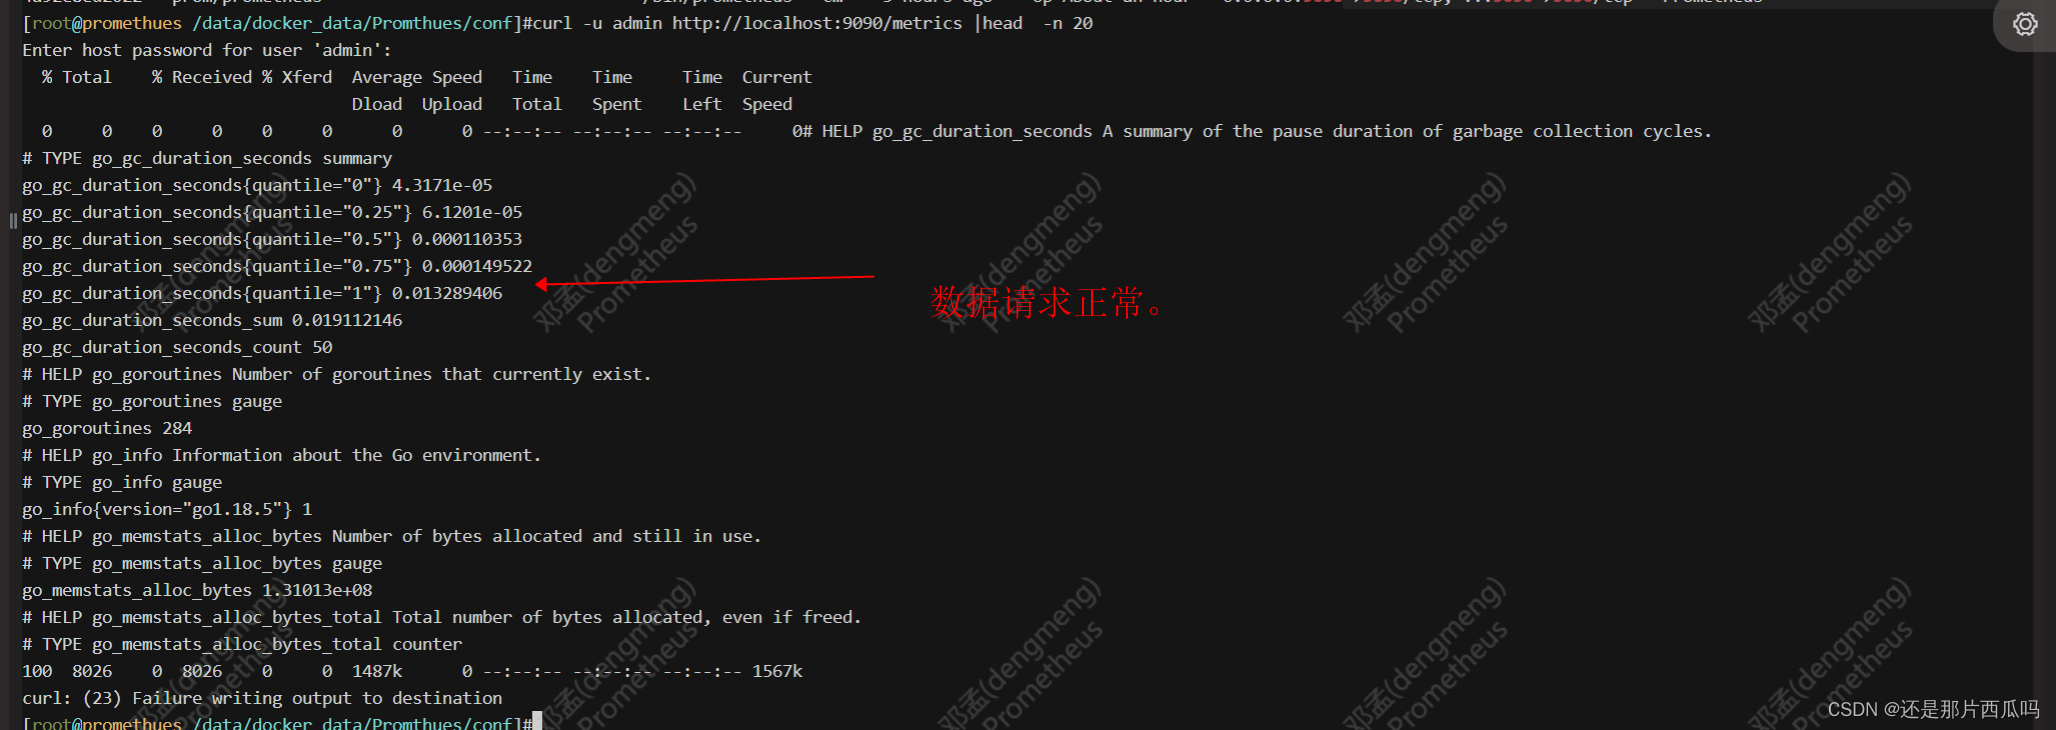
1、命令行验证
cURL 与您的设置进行交互。请尝试此请求:
curl --head http://localhost:9090/graph
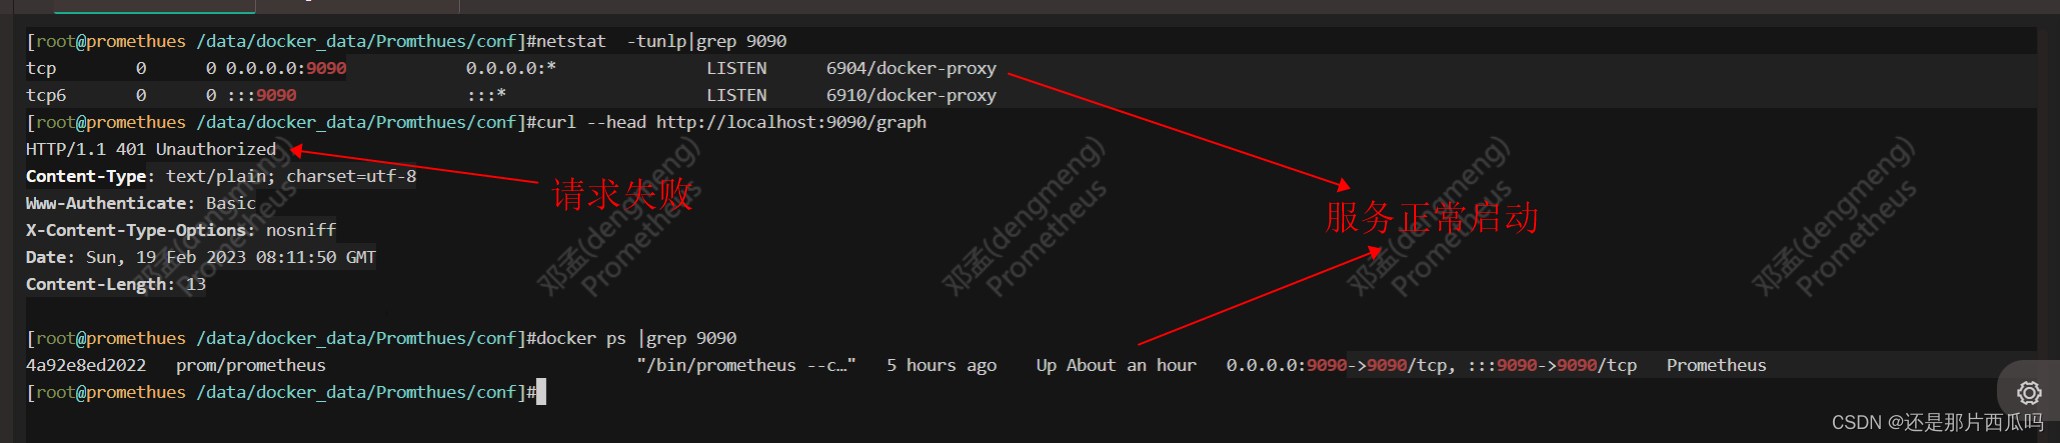
因为您未能提供有效的用户名和密码。401 Unauthorized
由此请求代入用户和密码,进行二次验证
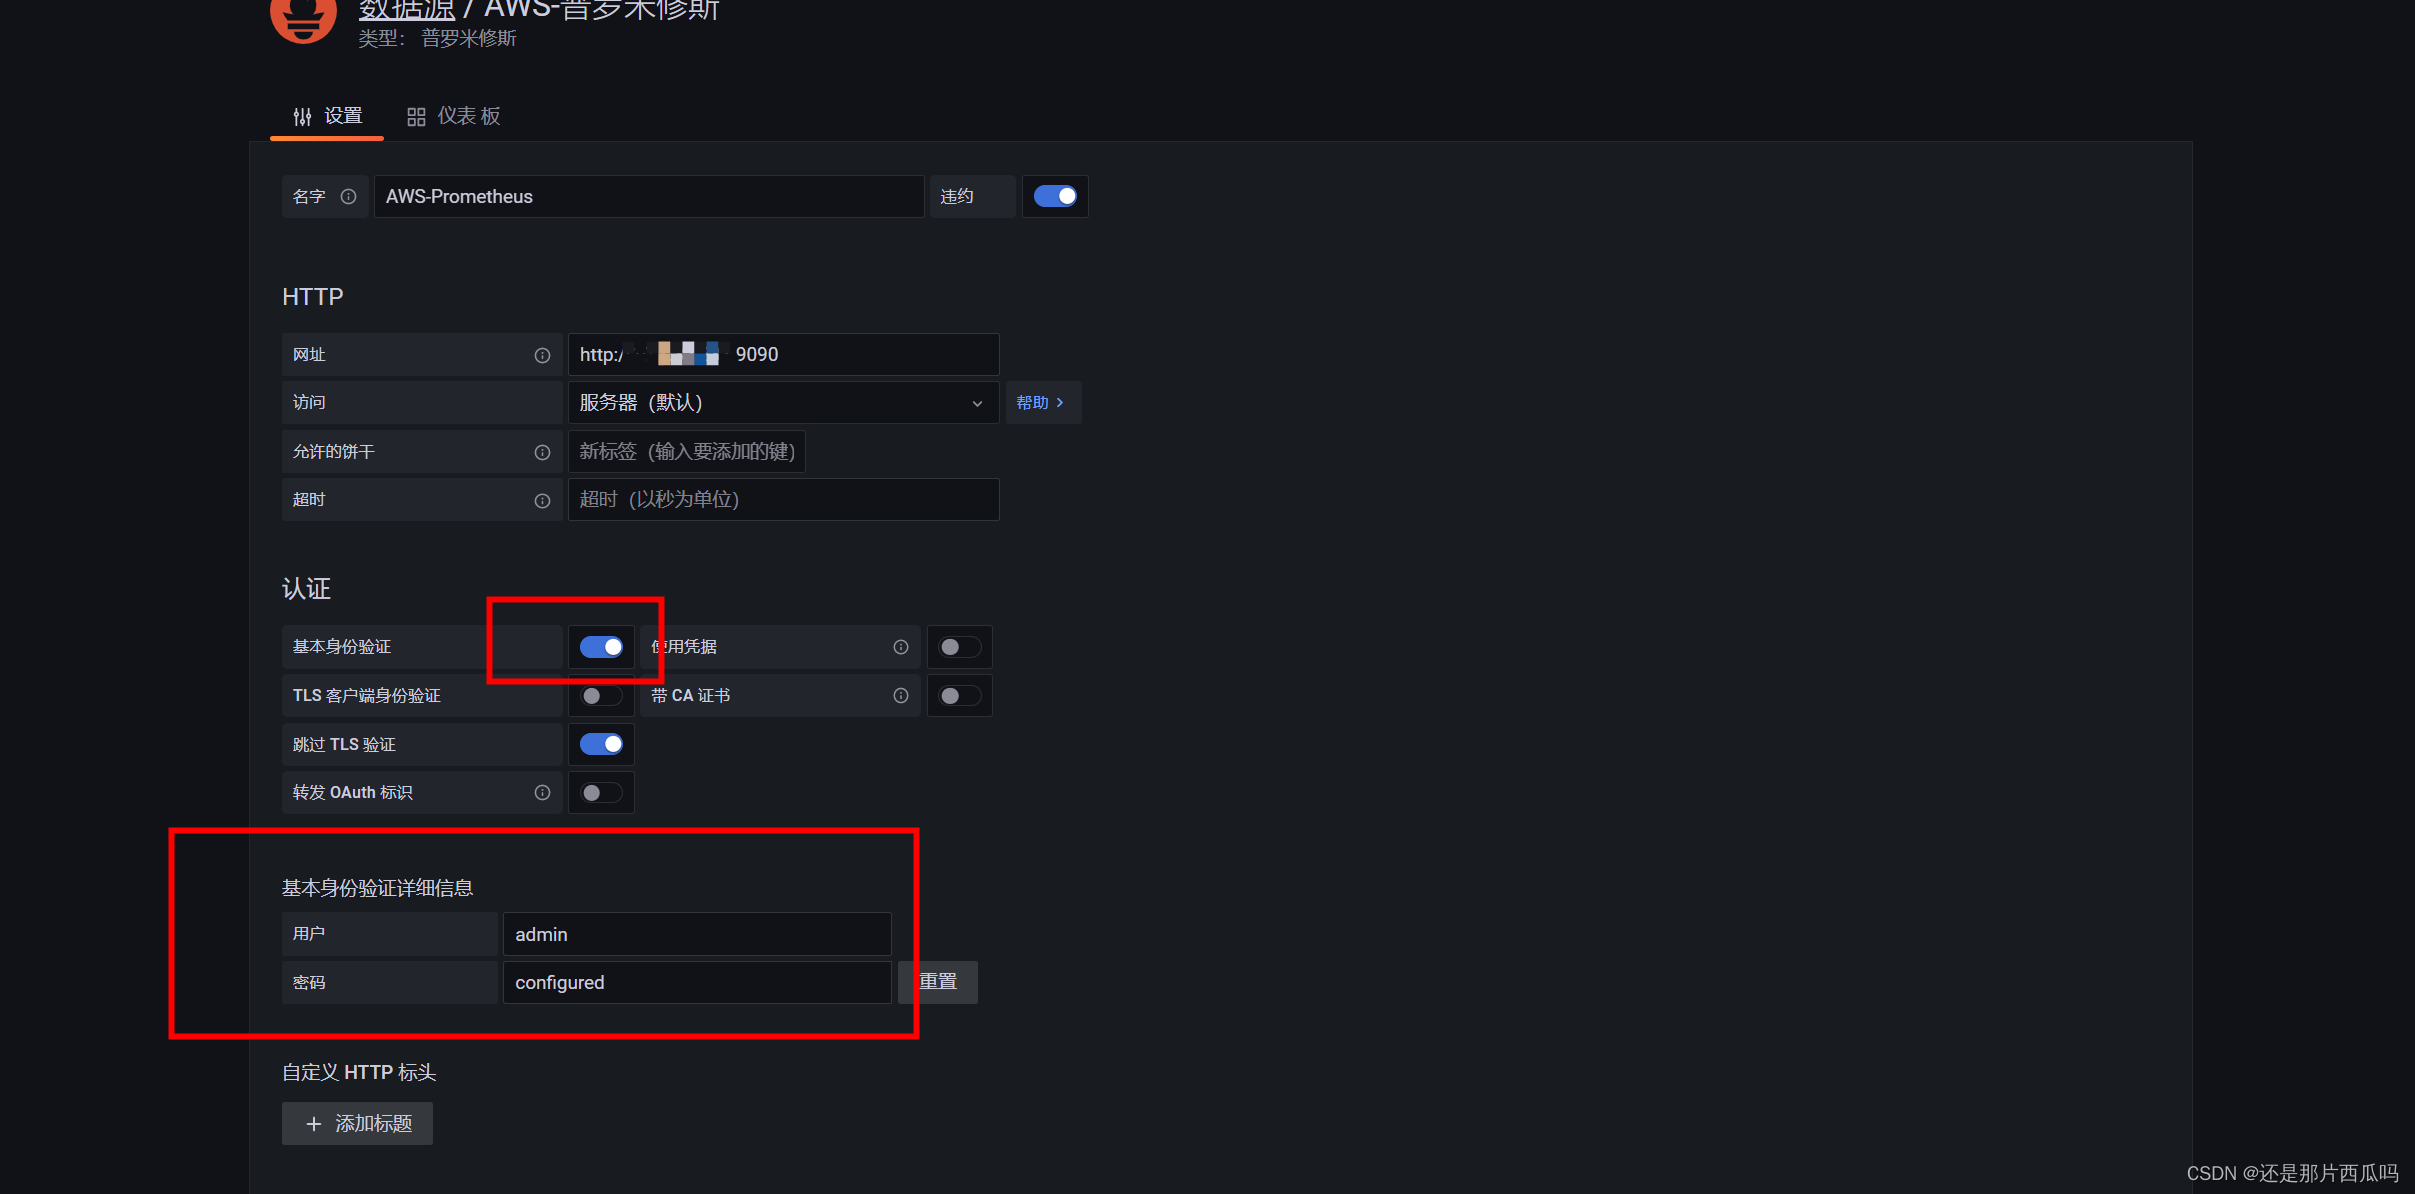
curl -u admin http://localhost:9090/metrics
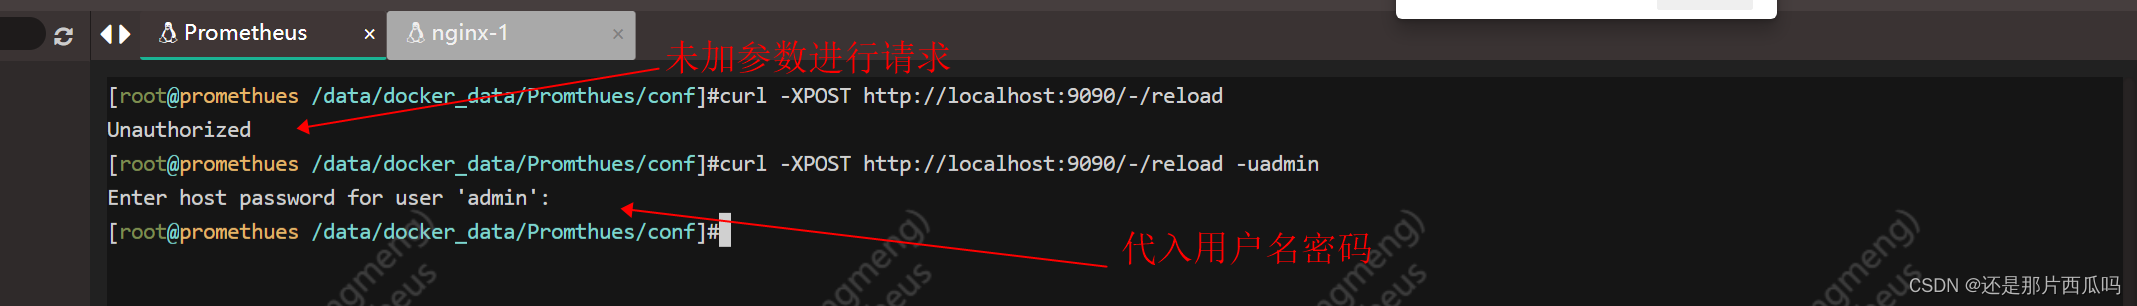
注:Prometheus服务热加载
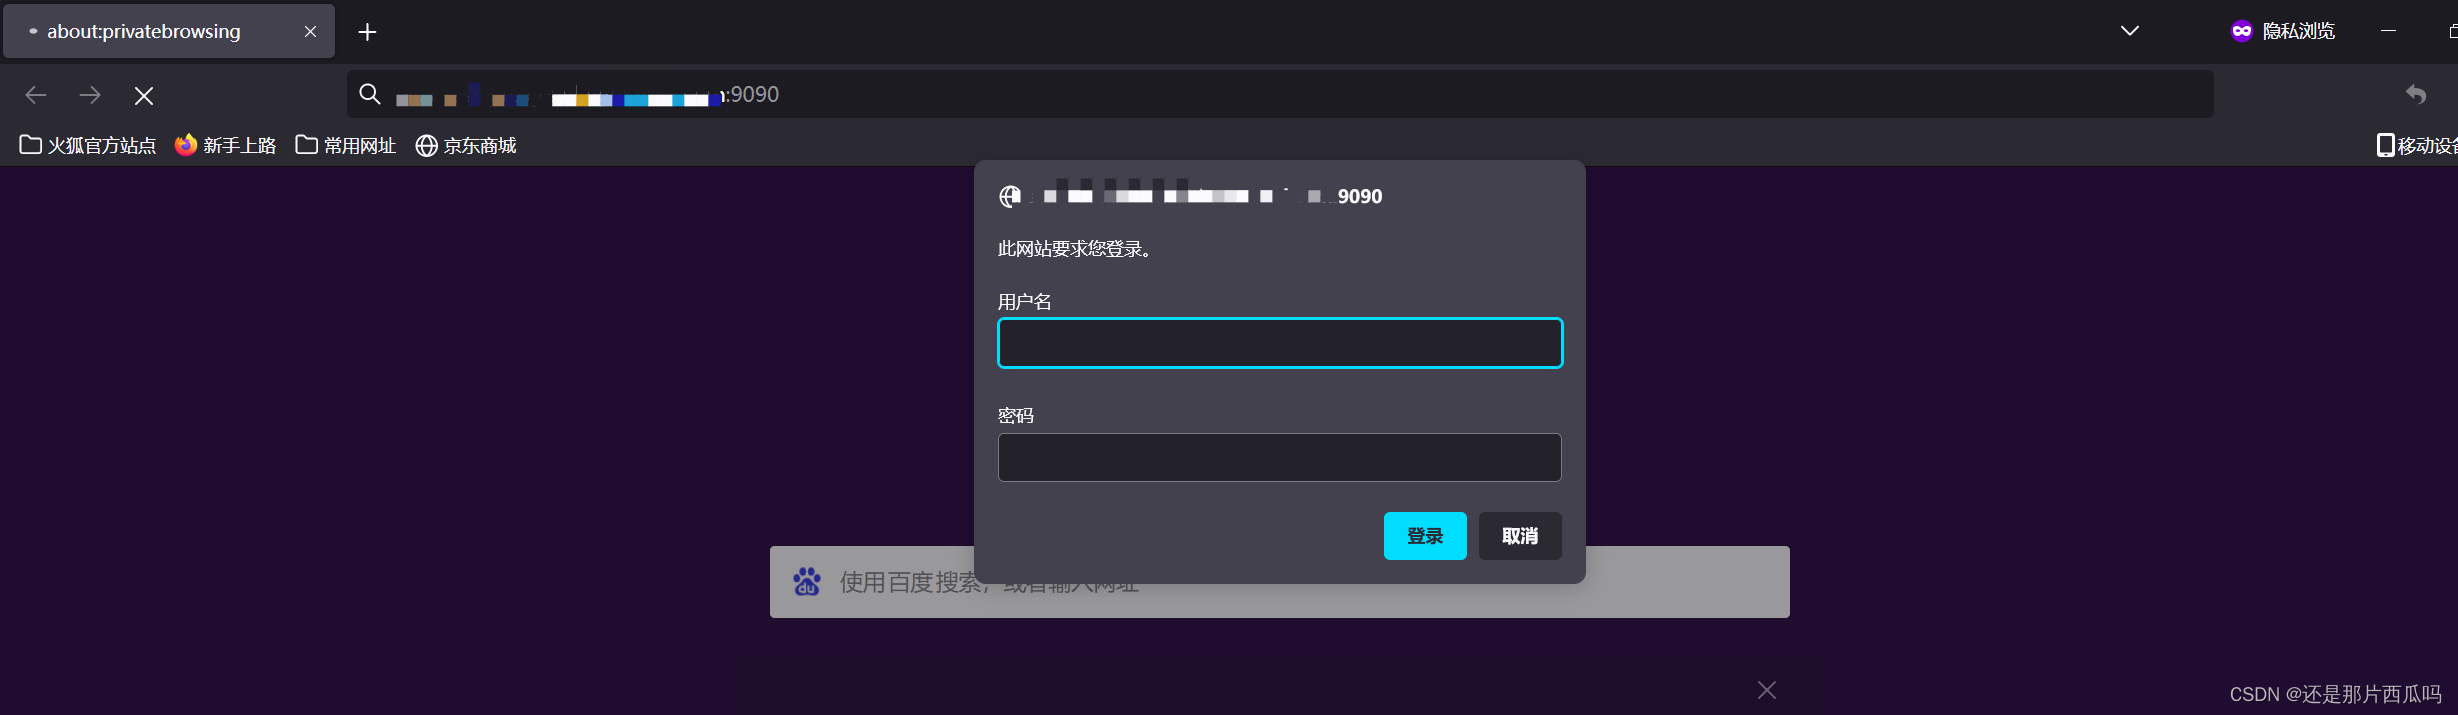
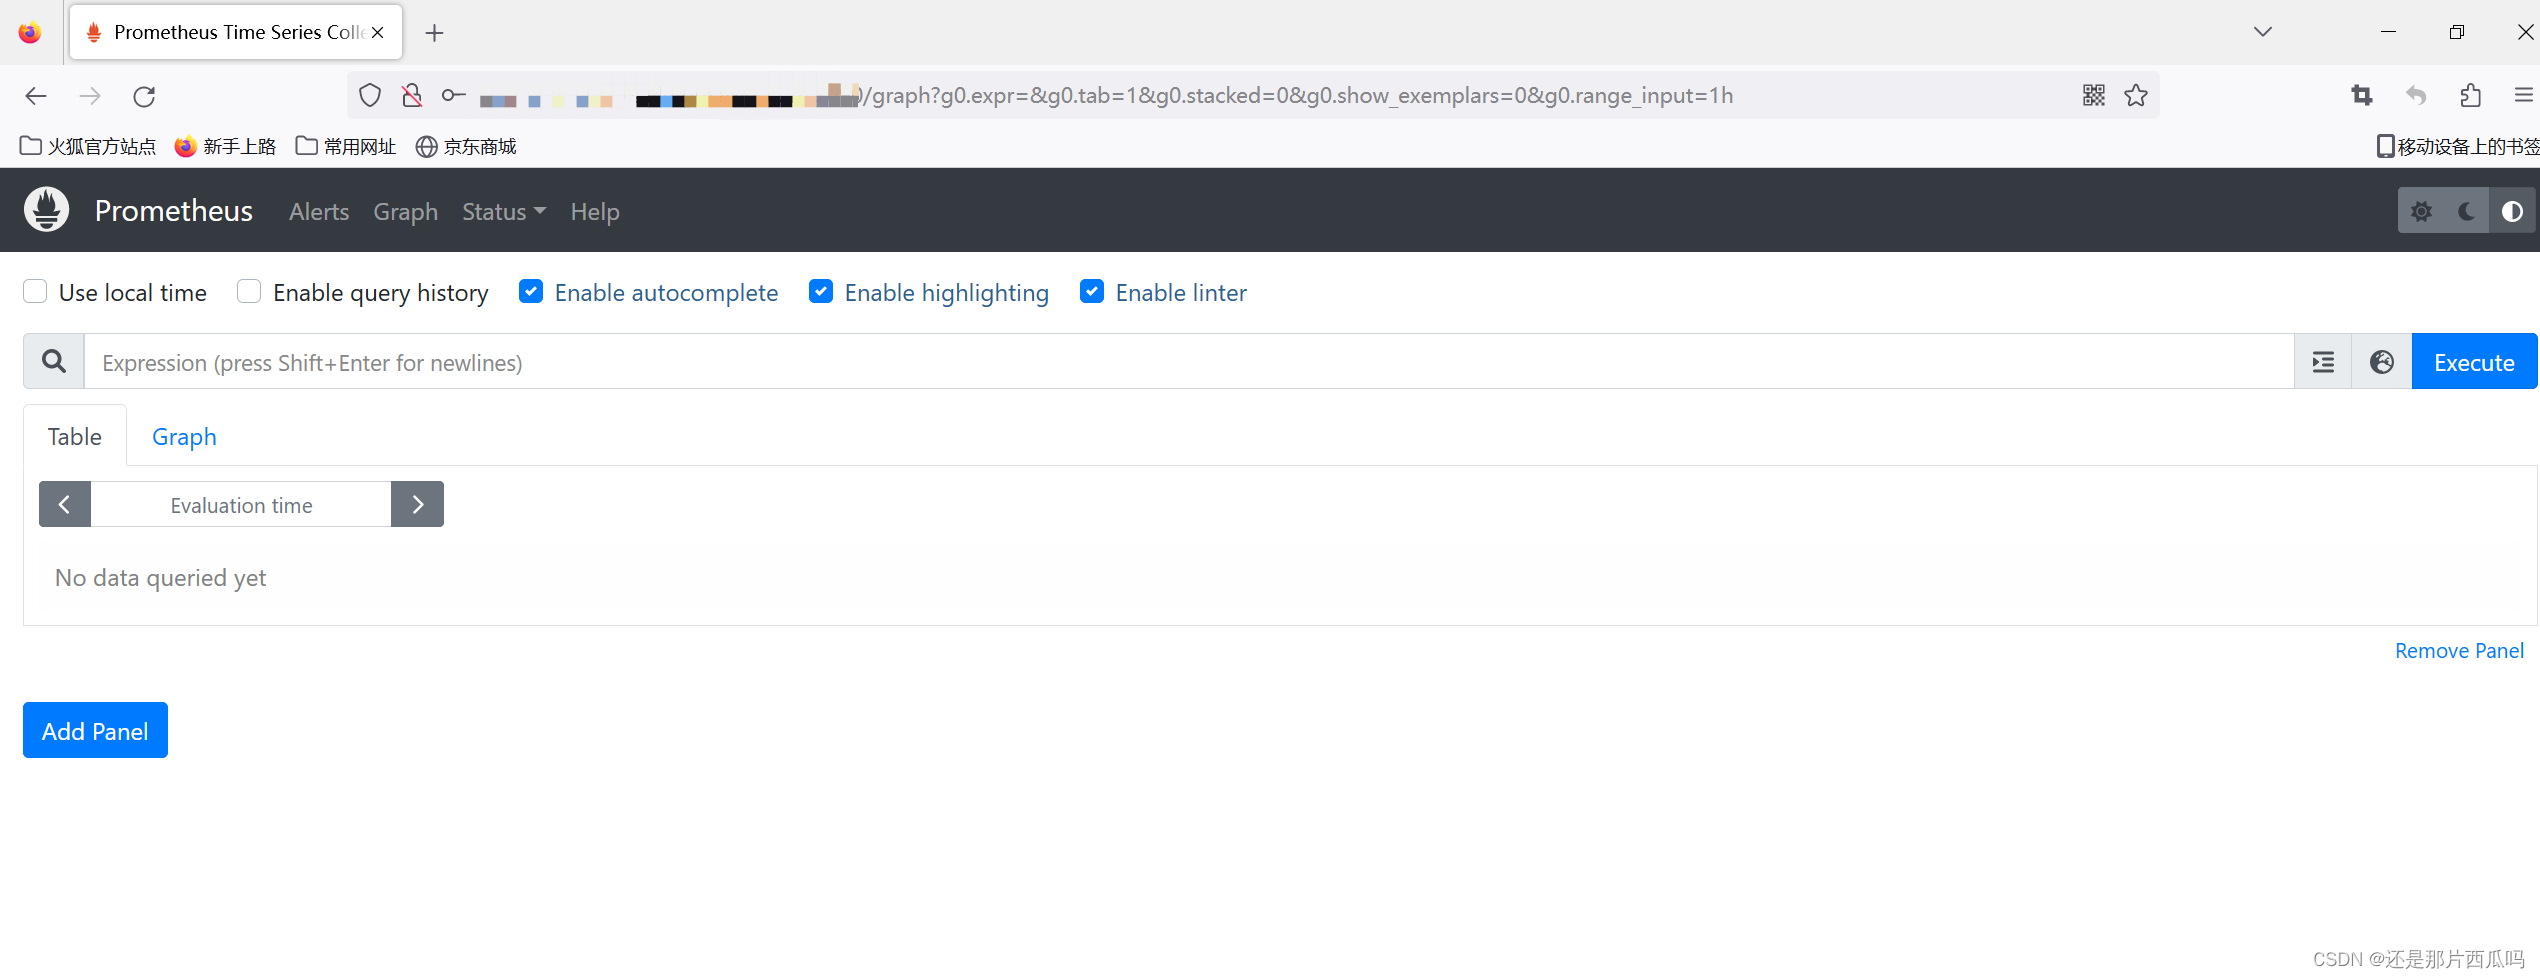
2、Web 界面验证
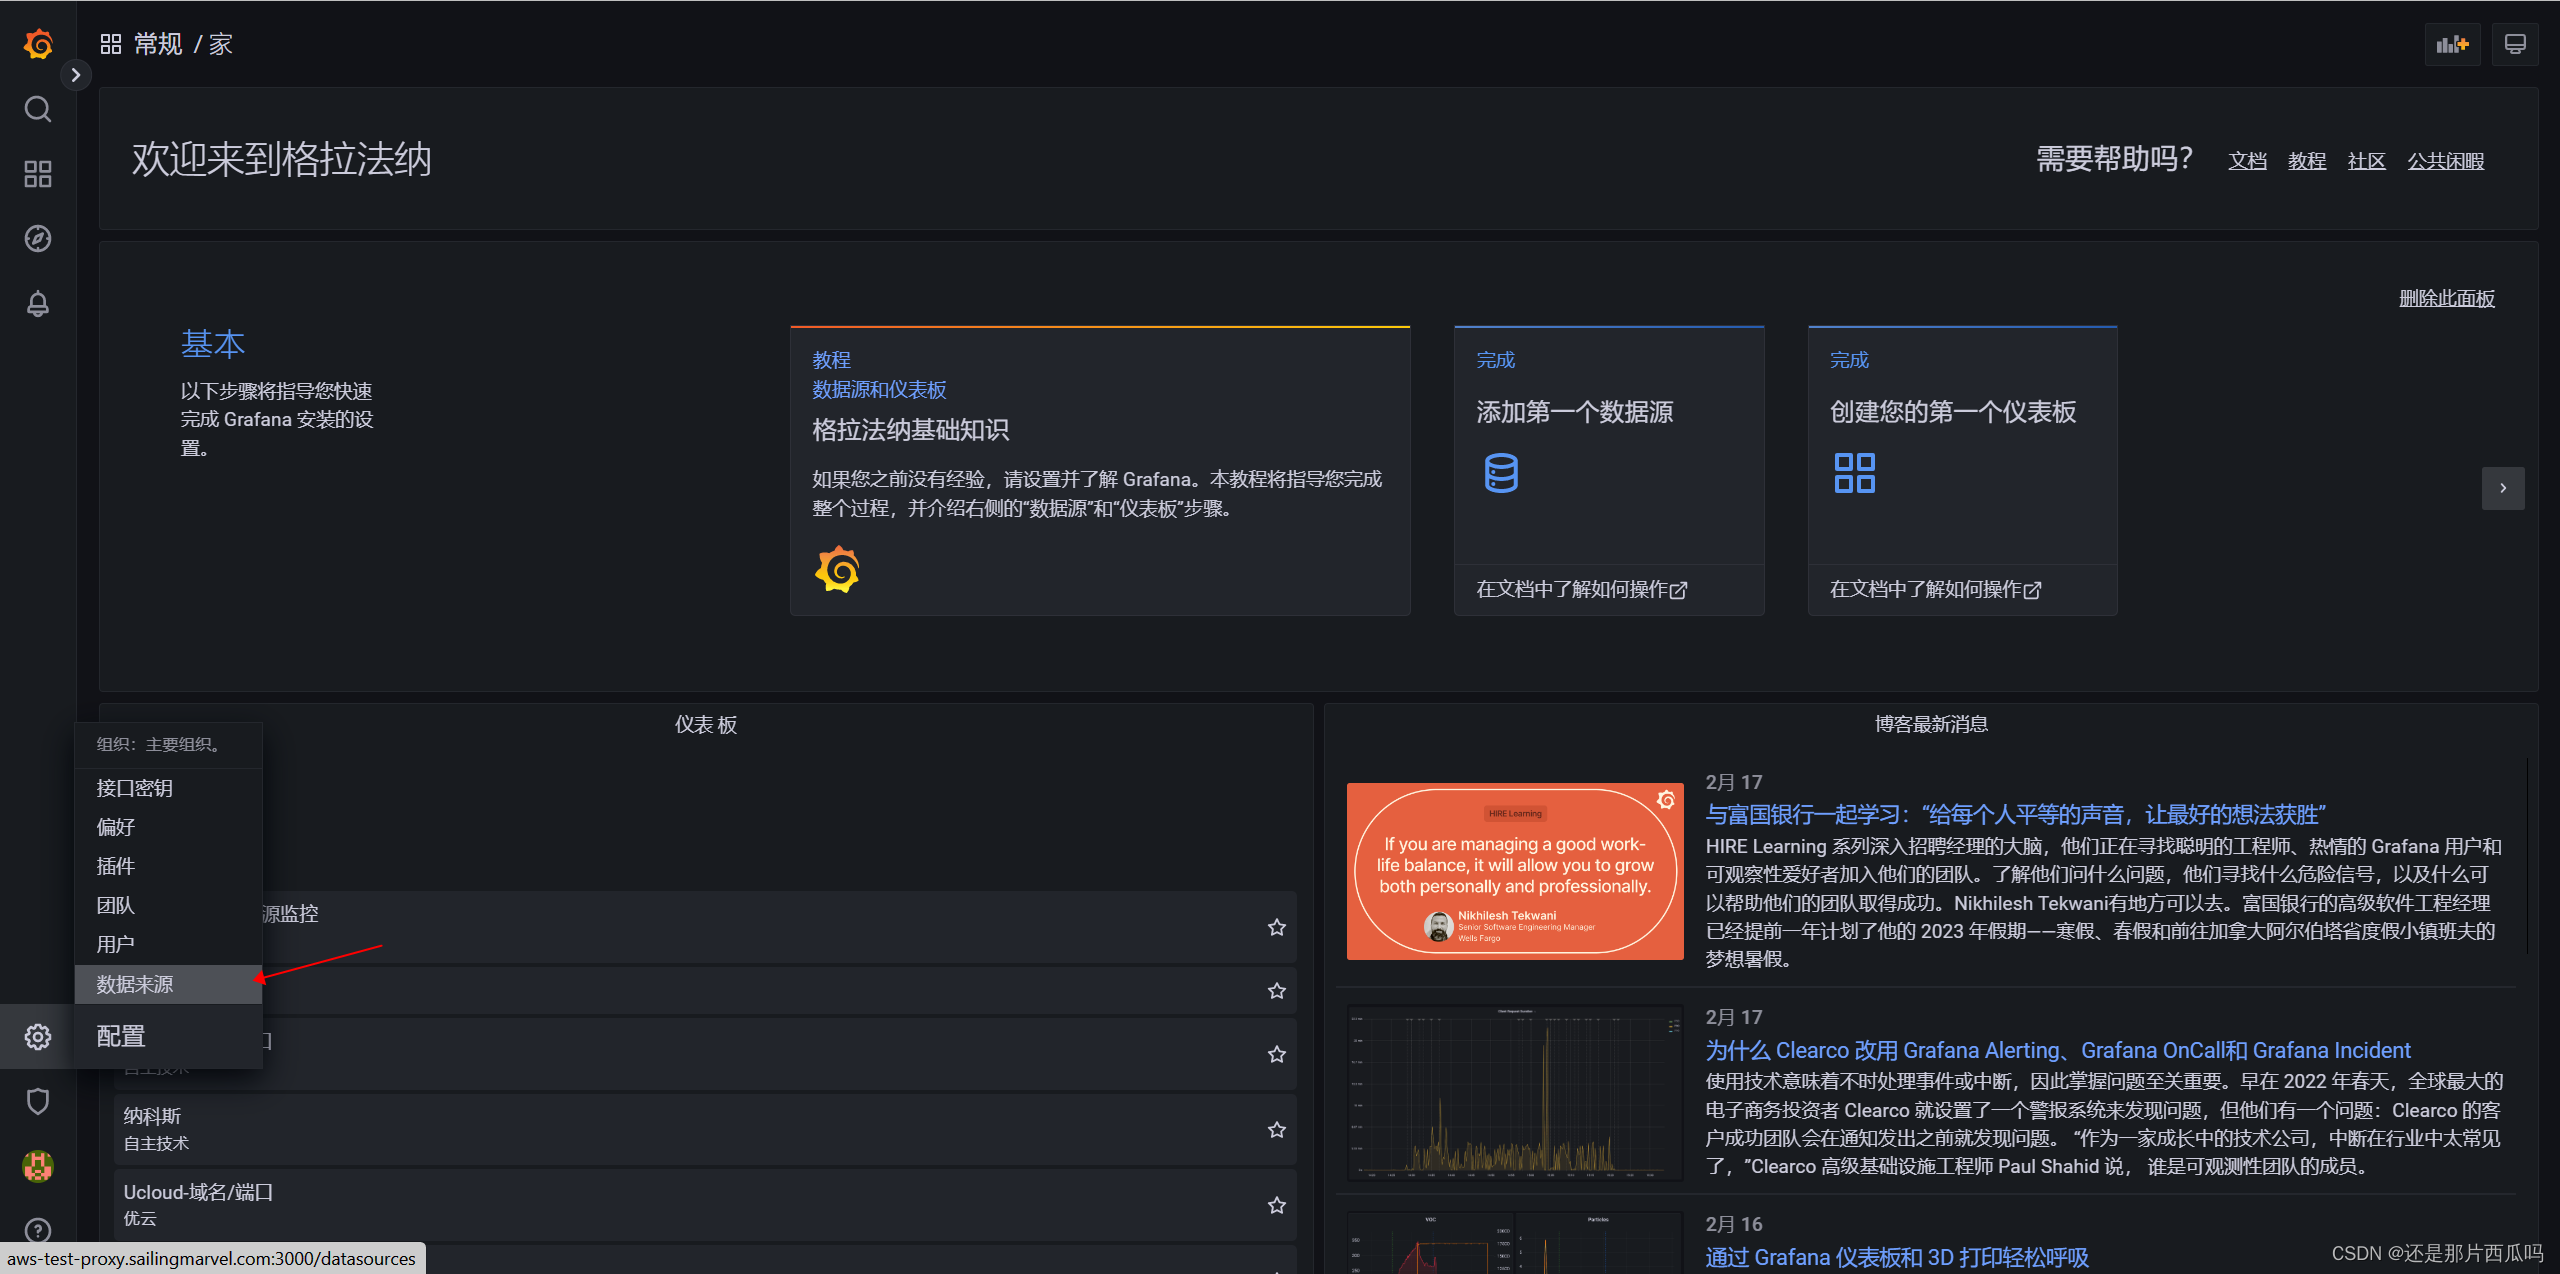
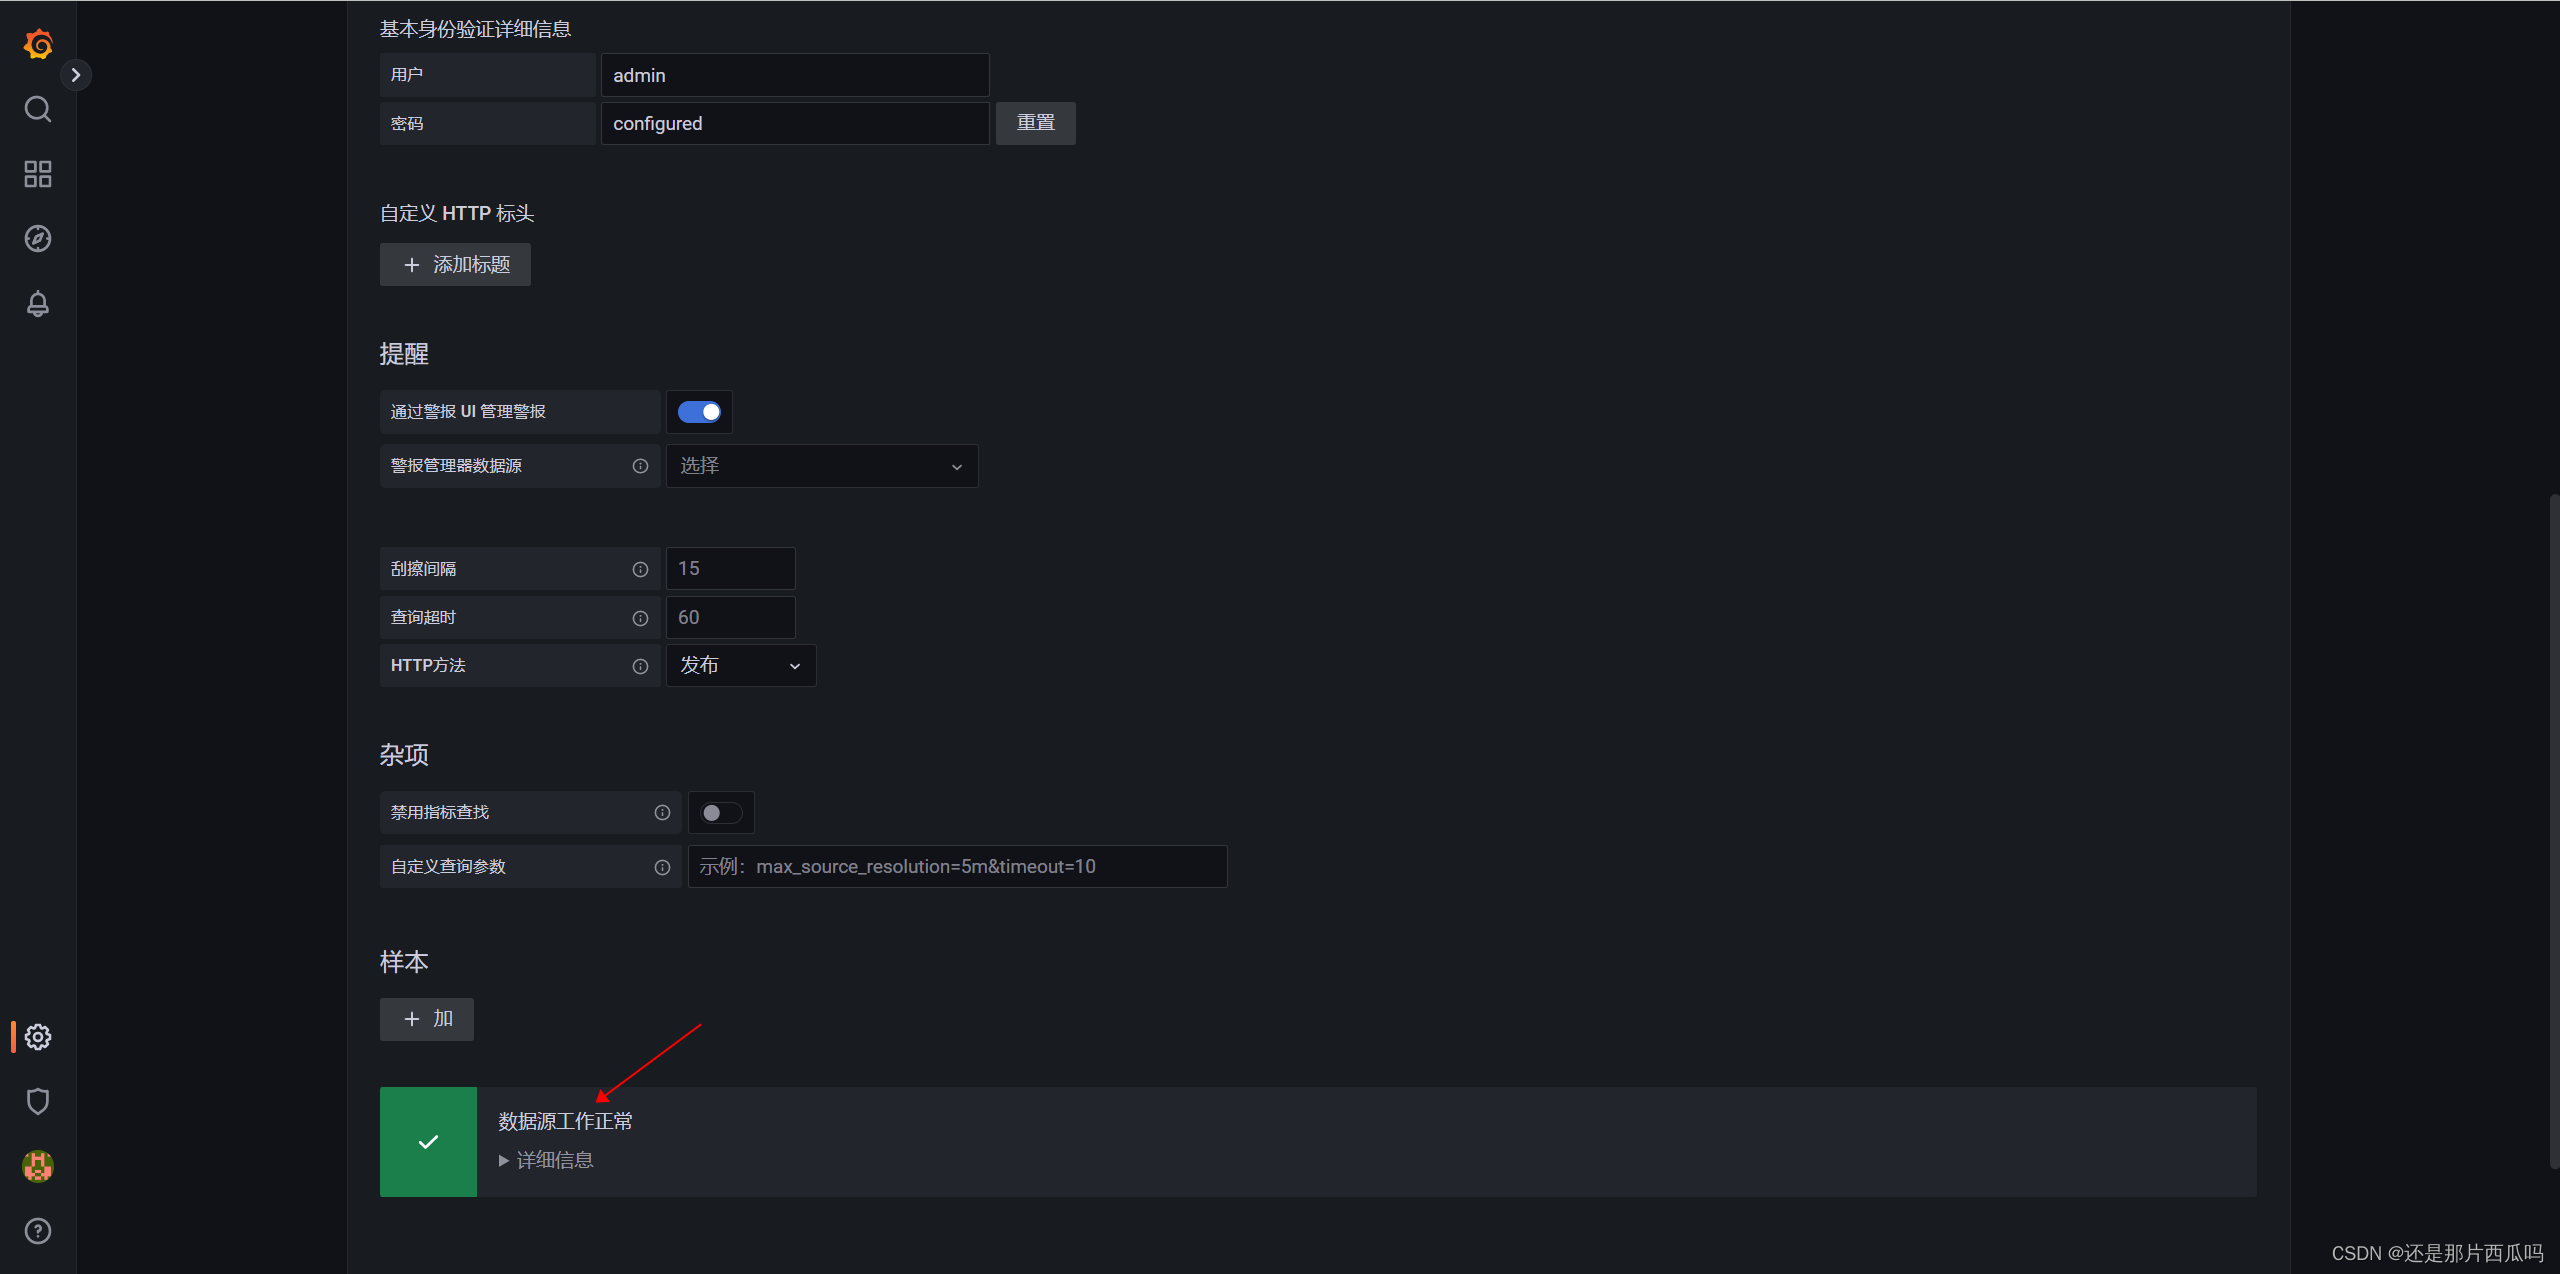
五、Grafana 数据源配置


 2597
2597

 被折叠的 条评论
为什么被折叠?
被折叠的 条评论
为什么被折叠?
 到【灌水乐园】发言


