


这里设置图表的宽高:

<div id="main" style="width: 100%;height: 300px;margin-left: 5%"></div>
添加图表的属性:
showchart() {
    var myChart = echarts.init(document.getElementById('main'));
    this.option = {
        stillShowZeroSum: true,
        // grid: {   //绘图区调整
        //     x: 100,  //左留白
        //     y: 10,   //上留白
        //     x2: 100,  //右留白
        //     y2: 10   //下留白
        // },
        tooltip: {
            trigger: 'item',
            formatter: '{b}:{c}'
        },
        xAxis: [
            {
                show: false,
                type: 'value',
                boundaryGap: [0, 0],
                position: 'top',
            }
        ],
        yAxis: [
            {
                type: 'category',
                data: ['提交审核\n\n\n\n\n审核通过'],
                axisLine: {show: false},     //坐标轴
                axisTick: [{    //坐标轴小标记
                    show: false
                }],
                axisLabel: {
                    textStyle: {
                        fontSize: '14'
                    }
                }
            }
        ],
        // color: ['#1685ff', '#7eef7d'],
        series: [
            {
                name: '1',
                type: 'bar',
                barMinHeight: 40,  //最小柱高
                barWidth: 50,
                barMaxWidth: 100,   //最大柱宽度
                data: [                  //每个模块的名字和值
                    {name: '提交审核', value: this.apply}
                ],
                itemStyle: {
                    normal: {
                        color: new echarts.graphic.LinearGradient(1, 0, 0, 0, [{
                            offset: 0,
                            color: '#4167FF'
                        }, {
                            offset: 1,
                            color: '#14D0FF'
                        }]),
                        // barBorderRadius: 12,
                        label: {
                            show: true,//饼图上是否出现标注文字 标注各模块代表什么  默认是true
                            fontSize: '14',
                            position: 'right'
                        }
                    },

                },
            },
            {
                name: '2',
                type: 'bar',
                barMinHeight: 40,  //最小柱高
                barWidth: 50,
                barMaxWidth: 100,   //最大柱宽度
                data: [                  //每个模块的名字和值
                    {name: '审核通过', value: this.adopt}
                ],

                itemStyle: {
                    normal: {
                        color: new echarts.graphic.LinearGradient(1, 0, 0, 0, [{
                            offset: 0,
                            color: '#89E821'
                        }, {
                            offset: 1,
                            color: '#BEF545'
                        }]),
                        // barBorderRadius: 12,
                        label: {
                            show: true,//图上是否出现标注文字 标注各模块代表什么  默认是true
                            fontSize: '14',
                            position: 'right'
                        }
                    },
                },
            }
        ]
    };
    myChart.setOption(this.option);
},
在钩子函数中调用:
this.showchart();
拿到数据后赋值:
this.option.series[0].data[0].value = respond.data.data.apply
this.option.series[1].data[0].value = respond.data.data.adopt
var myChart = echarts.init(document.getElementById('main'))
myChart.setOption(this.option);
效果如下:
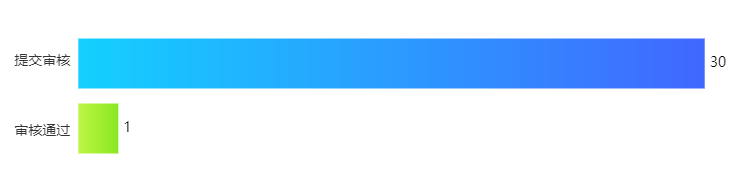


 3767
3767


 被折叠的 条评论
为什么被折叠?
被折叠的 条评论
为什么被折叠?
 到【灌水乐园】发言


