


2.2 决策树的绘制
为了更好地发挥决策树易于理解的优点,我们使用Matplotlib将创建的决策树绘制出来。此处调用函数createPlot()对决策树进行绘制。
实现过程如下:
创建模块DecisionTreePlotter及其存储文件DecisionTreePlotter.py;
调用函数plt.figure()创建一个figure;
调用函数plt.subplot()在figure中创建一个子图;
调用函数getNumLeafs()获得决策树的叶子树,即树的宽度;
调用函数getTreeDepth()获得决策树的深度;
调用函数plotTree()绘制整棵决策树,最后显示出来。
具体代码如下:
- #创建figure并绘制树inTree
- def createPlot(inTree):
- #Matplotlib 里的常用类的包含关系为 Figure -> Axes -> (Line2D, Text, etc.)
- #一个Figure对象可以包含多个子图(Axes),在matplotlib中用Axes对象表示一个绘图区域,可以理解为子图。
- fig = plt.figure(1, facecolor = 'white') #定义一个figure对象,背景色设置为全白
- fig.clf() #清楚figure中的内容
- axprops = dict(xticks = [], yticks = [])
- createPlot.ax1 = plt.subplot(111, frameon = False, **axprops) #在图表fig中创建一个子图ax1
- plotTree.totalW = float(getNumLeafs(inTree)) #获取样本树的叶子结点数目作为plotTree的宽度
- plotTree.totalD = float(getTreeDepth(inTree)) #获取样本树的深度作为plotTree的深度
- plotTree.xOff = -0.5 / plotTree.totalW;
- plotTree.yOff = 1.0
- plotTree(inTree, (0.5, 1.0), '') #依次绘制整棵决策树
- plt.show()
函数getNumLeafs:
该函数定义为:def getNumLeafs(myTree)
用来获取当前树中的叶子结点数目;
函数实现:
获取参数myTree的根结点;
获取根结点下的各个子树;
对各个子树依次循环,如果还是子树,则递归调用函数getNumLeafs()获取子树的叶子结点数目;否则叶子结点数目加1。
最后返回所有的叶子结点数目;
具体代码如下:
def getNumLeafs(myTree):
    numLeafs = 0
    #firstKey = tree.keys()[0]  书上的代码有点小错误,因为python里的字典是不支持索引的,
    #如果运行,会报错'dict_keys' object does not support indexing,下面加以改正:
    for key in myTree.keys():
        firstStr = key #获取当前树myTree中第一个key,即该树的根节点
    secondDict = myTree[firstStr] #获取第一个key对应的内容,即根节点下的子树
    for key in secondDict.keys(): #根节点对应的各个分支,依次循环
        #type()就是一个最实用又简单的查看数据类型的方法。
        #type()是一个内建的函数,调用它就能够得到一个反回值,从而知道想要查询的对像类型信息。
        if type(secondDict[key]).__name__ == 'dict': #如果该子树还是一棵树,递归调用函数getNumLeafs(),获取子树的叶子结点数
            numLeafs += getNumLeafs(secondDict[key])
        else: #如果是叶子结点,则叶子数加1
            numLeafs += 1
return numLeafs #返回当前树中叶子结点的个数函数getTreeDepth:
该函数定义为:def getTreeDepth(myTree)
用来获取当前树的最大深度;
函数实现:
获取参数myTree的根结点;
获取根结点下的各个子树;
对各个子树依次循环,如果还是子树,则递归调用函数getTreeDepth ()获取子树的深度并加1;否则为叶子结点,返回1。
判断当前子树是否最深子树;如果是,则更新最大深度信息;
最后返回最大深度信息;
具体代码如下:def getTreeDepth(myTree):
maxDepth = 0 #用来记录最高子树的高度+1
# firstKey = tree.keys()[0] 书上的代码有点小错误,因为python里的字典是不支持索引的,
# 如果运行,会报错'dict_keys' object does not support indexing,下面加以改正:
for key in myTree.keys():
firstStr = key #获取树的根节点
secondDict = myTree[firstStr] #获取树的子树
for key in secondDict.keys(): #根节点对应的各个分支,依次循环
#如果该子树还是一棵树,递归调用函数getTreeDepth(),获取子树的深度
if type(secondDict[key]).__name__ == 'dict':
thisDepth = 1 + getTreeDepth(secondDict[key])
else: #如果是叶子结点,则返回1
thisDepth = 1
if thisDepth > maxDepth: #更新最大深度变量值
maxDepth = thisDepth
return maxDepth #返回最大深度函数plotTree:
该函数定义为:def plotTree(myTree, parentPt, nodeTxt)
用来绘制决策树myTree;
函数实现:
调用函数getNumLeafs()获取叶子结点数目;
调用函数getTreeDepth()获取决策树最大深度;
获取根结点;
调用函数plotMidText()绘制文本信息nodeTxt;
调用函数plotNode()绘制结点;
获取各个子树,依次循环:如果还是子树,则递归调用函数plotTree()继续绘制子树;否则,为叶子结点,调用函数plotNode()绘制叶子结点;
具体代码如下:
def plotTree(myTree, parentPt, nodeTxt):
numLeafs = getNumLeafs(myTree) #获取样本树的叶子结点数目
depth = getTreeDepth(myTree) #获取样本树的深度
# firstKey = tree.keys()[0] 书上的代码有点小错误,因为python里的字典是不支持索引的,
# 如果运行,会报错'dict_keys' object does not support indexing,下面加以改正:
for key in myTree.keys():
firstStr = key #获取样本树的根结点
cntrPt = (plotTree.xOff + (1.0 + float(numLeafs)) / 2.0 / plotTree.totalW, \
plotTree.yOff)
plotMidText(cntrPt, parentPt, nodeTxt) #绘制文本信息nodeTxt
plotNode(firstStr, cntrPt, parentPt, decisionNode) #绘制根结点
secondDict = myTree[firstStr] #获取各个子树
plotTree.yOff = plotTree.yOff - 1.0 / plotTree.totalD
for key in secondDict.keys(): #循环遍历各个子树
if type(secondDict[key]).__name__ == 'dict': #如果包含的是子树,递归调用plotTree绘制结点
plotTree(secondDict[key], cntrPt, str(key))
else:
plotTree.xOff = plotTree.xOff + 1.0 / plotTree.totalW
plotNode(secondDict[key], (plotTree.xOff, plotTree.yOff), cntrPt, leafNode) #绘制叶子结点
plotMidText((plotTree.xOff, plotTree.yOff), cntrPt, str(key)) #绘制文字注释
plotTree.yOff = plotTree.yOff + 1.0 / plotTree.totalD #调整Y轴的坐标值
firstPt = (plotTree.xOff + (1.0 + float(leafNum)) / 2.0/plotTree.totalW,\ plotTree.yOff)
可以参照这篇博文:http://blog.csdn.net/liyuefeilong/article/details/48244529
函数plotMidText:
该函数定义为:def plotMidText(cntrPt, parentPt, txtString)
用来显示文本信息txtString;
函数实现:
计算好x,y坐标后,调用函数createPlot.ax1.text()完成文本的显示。
具体代码如下:
- #显示文本,在坐标点cntrPt和parentPt连接线上的中点,显示文本txtString
- def plotMidText(cntrPt, parentPt, txtString):
- xMid = (parentPt[0] - cntrPt[0]) / 2.0 + cntrPt[0] #计算x坐标
- yMid = (parentPt[1] - cntrPt[1]) / 2.0 + cntrPt[1] #计算y坐标
- createPlot.ax1.text(xMid, yMid, txtString) #在(xMid, yMid)处显示txtString
函数plotNode:
该函数定义为:def plotNode(nodeTxt, centerPt, parentPt, nodeType)
绘制一个结点,nodeTxt为结点显示文本,centerPt为文本起始位置,parentPt为箭头的起始位置,nodeType为结点框的样式;
函数实现:调用函数createPlot.ax1.annotate()直接绘制结点,需要设置好相关参数。
具体代码如下:
- #绘制一个结点,nodeTxt为结点显示文本,centerPt为文本起始位置,parentPt为箭头的起始位置,nodeType为结点框的样式
- def plotNode(nodeTxt, centerPt, parentPt, nodeType):
- #使用annotate()方法可以很方便地添加文字注释
- # 第一个参数是注释的内容
- # xy设置箭头尖的坐标
- # xytext设置注释内容显示的起始位置
- # arrowprops 用来设置箭头样式
- # bbox用来设置节点框的样式
- # xycoords and textcoords 是坐标xy与xytext的说明,若textcoords=None,则默认textNone与xycoords相同,若都未设置,默认为data
- # va/ha设置节点框中文字的位置,va取值为(u'top', u'bottom', u'center', u'baseline'),ha取值为(u'center', u'right', u'left')
- createPlot.ax1.annotate(nodeTxt, xy = parentPt, xycoords = 'axes fraction',
- xytext = centerPt, textcoords = 'axes fraction',
- va = "center", ha = "center", bbox = nodeType, arrowprops = arrow_args)
因为上面解释的特别详细,所以整篇文章就沿用他人的经验总结了,但是做了一些错误的小修改。
以上内容来自:http://blog.csdn.net/icamera0/article/details/78078761
最后将绘制决策树的整个代码贴出来,修改了小错误后运行无误。代码如下:
'''
该部分代码在于使用Matpliotlib的相关模块实现决策树的绘制工作
'''
import matplotlib.pyplot as plt
''' 定义节点和箭头格式的常量'''
decisionNode = dict(boxstyle="sawtooth", fc="0.8")
leafNode = dict(boxstyle="round4", fc="0.8")
arrow_args = dict(arrowstyle="<-")
'''显示文本,在坐标点cntrPt和parentPt连接线上的中点,显示文本txtString'''
def plotMidText(cntrPt, parentPt, txtString):
xMid = (parentPt[0] - cntrPt[0]) / 2.0 + cntrPt[0] #计算x坐标
yMid = (parentPt[1] - cntrPt[1]) / 2.0 + cntrPt[1] #计算y坐标
createPlot.ax1.text(xMid, yMid, txtString) #在(xMid, yMid)处显示txtString
''' 绘制自身
若当前子节点不是叶子节点,递归
若当子节点为叶子节点,绘制该节点'''
def plotTree(myTree, parentPt, nodeTxt):
numLeafs = getNumLeafs(myTree) #获取样本树的叶子结点数目
depth = getTreeDepth(myTree) #获取样本树的深度
# firstKey = tree.keys()[0] 书上的代码有点小错误,因为python里的字典是不支持索引的,
# 如果运行,会报错'dict_keys' object does not support indexing,下面加以改正:
for key in myTree.keys():
firstStr = key #获取样本树的根结点
cntrPt = (plotTree.xOff + (1.0 + float(numLeafs)) / 2.0 / plotTree.totalW, \
plotTree.yOff)
plotMidText(cntrPt, parentPt, nodeTxt) #绘制文本信息nodeTxt
plotNode(firstStr, cntrPt, parentPt, decisionNode) #绘制根结点
secondDict = myTree[firstStr] #获取各个子树
plotTree.yOff = plotTree.yOff - 1.0 / plotTree.totalD
for key in secondDict.keys(): #循环遍历各个子树
if type(secondDict[key]).__name__ == 'dict': #如果包含的是子树,递归调用plotTree绘制结点
plotTree(secondDict[key], cntrPt, str(key))
else:
plotTree.xOff = plotTree.xOff + 1.0 / plotTree.totalW
plotNode(secondDict[key], (plotTree.xOff, plotTree.yOff), cntrPt, leafNode) #绘制叶子结点
plotMidText((plotTree.xOff, plotTree.yOff), cntrPt, str(key)) #绘制文字注释
plotTree.yOff = plotTree.yOff + 1.0 / plotTree.totalD #调整Y轴的坐标值
''' 画结点的模板'''
def plotNode(nodeTxt, centerPt, parentPt, nodeType):
createPlot.ax1.annotate(nodeTxt, # 注释的文字,(一个字符串)
xy=parentPt, # 被注释的地方(一个坐标)
xycoords='axes fraction', # xy所用的坐标系
xytext=centerPt, # 插入文本的地方(一个坐标)
textcoords='axes fraction', # xytext所用的坐标系
va="center",
ha="center",
bbox=nodeType, # 注释文字用的框的格式
arrowprops=arrow_args) # 箭头属性
'''创建figure并绘制树inTree'''
def createPlot(inTree):
#Matplotlib 里的常用类的包含关系为 Figure -> Axes -> (Line2D, Text, etc.)
#一个Figure对象可以包含多个子图(Axes),在matplotlib中用Axes对象表示一个绘图区域,可以理解为子图。
fig = plt.figure(1, facecolor = 'white') #定义一个figure对象,背景色设置为全白
fig.clf() #清楚figure中的内容
axprops = dict(xticks = [], yticks = [])
createPlot.ax1 = plt.subplot(111, frameon = False, **axprops) #在图表fig中创建一个子图ax1
plotTree.totalW = float(getNumLeafs(inTree)) #获取样本树的叶子结点数目作为plotTree的宽度
plotTree.totalD = float(getTreeDepth(inTree)) #获取样本树的深度作为plotTree的深度
plotTree.xOff = -0.5 / plotTree.totalW;
plotTree.yOff = 1.0
plotTree(inTree, (0.5, 1.0), '') #依次绘制整棵决策树
plt.show()
'''获取当前树中的叶子结点数目'''
def getNumLeafs(myTree):
numLeafs = 0
#firstKey = tree.keys()[0] 书上的代码有点小错误,因为python里的字典是不支持索引的,
#如果运行,会报错'dict_keys' object does not support indexing,下面加以改正:
for key in myTree.keys():
firstStr = key #获取当前树myTree中第一个key,即该树的根节点
secondDict = myTree[firstStr] #获取第一个key对应的内容,即根节点下的子树
for key in secondDict.keys(): #根节点对应的各个分支,依次循环
#type()就是一个最实用又简单的查看数据类型的方法。
#type()是一个内建的函数,调用它就能够得到一个反回值,从而知道想要查询的对像类型信息。
if type(secondDict[key]).__name__ == 'dict': #如果该子树还是一棵树,递归调用函数getNumLeafs(),获取子树的叶子结点数
numLeafs += getNumLeafs(secondDict[key])
else: #如果是叶子结点,则叶子数加1
numLeafs += 1
return numLeafs #返回当前树中叶子结点的个数
'''获取当前树的最大深度,子树中树高最大的那一颗的高度+1作为当前数的高度'''
def getTreeDepth(myTree):
    maxDepth = 0   #用来记录最高子树的高度+1
    # firstKey = tree.keys()[0]  书上的代码有点小错误,因为python里的字典是不支持索引的,
    # 如果运行,会报错'dict_keys' object does not support indexing,下面加以改正:
    for key in myTree.keys():
        firstStr = key #获取树的根节点
    secondDict = myTree[firstStr] #获取树的子树
    for key in secondDict.keys(): #根节点对应的各个分支,依次循环
        #如果该子树还是一棵树,递归调用函数getTreeDepth(),获取子树的深度
        if type(secondDict[key]).__name__ == 'dict':
            thisDepth = 1 + getTreeDepth(secondDict[key])
        else: #如果是叶子结点,则返回1
            thisDepth = 1
        if thisDepth > maxDepth: #更新最大深度变量值
            maxDepth = thisDepth
    return maxDepth #返回最大深度
'''方便测试用的人造测试树'''
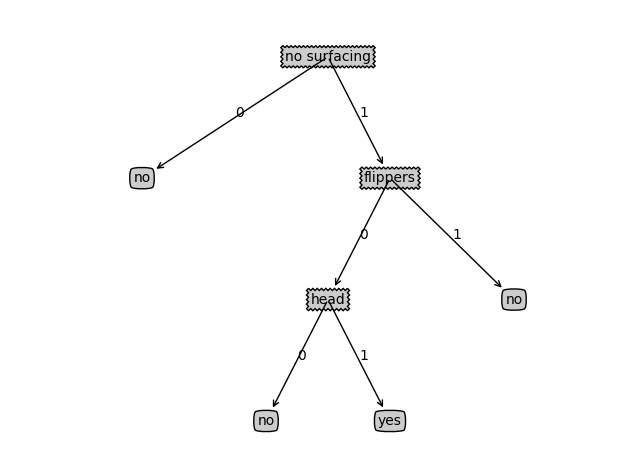
def retrieveTree(i):
listofTrees = [{'no surfacing': {0: 'no', 1: {'flippers': {0: 'no', 1: 'yes'}}}},
{'no surfacing': {0: 'no', 1: {'flippers': {0: {'head': {0: 'no', 1: 'yes'}}, 1: 'no'}}}}
]
return listofTrees[i]
if __name__ == "__main__":
myTree = retrieveTree(1)
createPlot(myTree)程序结果为:


 405
405

 被折叠的 条评论
为什么被折叠?
被折叠的 条评论
为什么被折叠?
 到【灌水乐园】发言


