


一、简单使用
1、添加依赖
implementation 'com.github.PhilJay:MPAndroidChart:v3.1.0'2、添加布局
<com.github.mikephil.charting.charts.LineChart
        android:layout_width="match_parent"
        android:layout_height="500dp"
        android:id="@+id/line_chart"/>
3、实例化
LineChart line_chart=findViewById(R.id.line_chart)4、通过for循环来随机设置几个数据
List<Entry> list=new ArrayList<>();
 for (int i=0;i<10;i++){
            list.add(new Entry(i, (float) (Math.random()*60)));
        }
注:Math.random()获取随机数,Math.random()*60表示获取1到59的随机数,取不到60
5、创建LineDataSet并设置数据,第一个参数表示纵坐标,第二个参数就是折线图的主题,就是代表这个折线图是什么类型的折线图
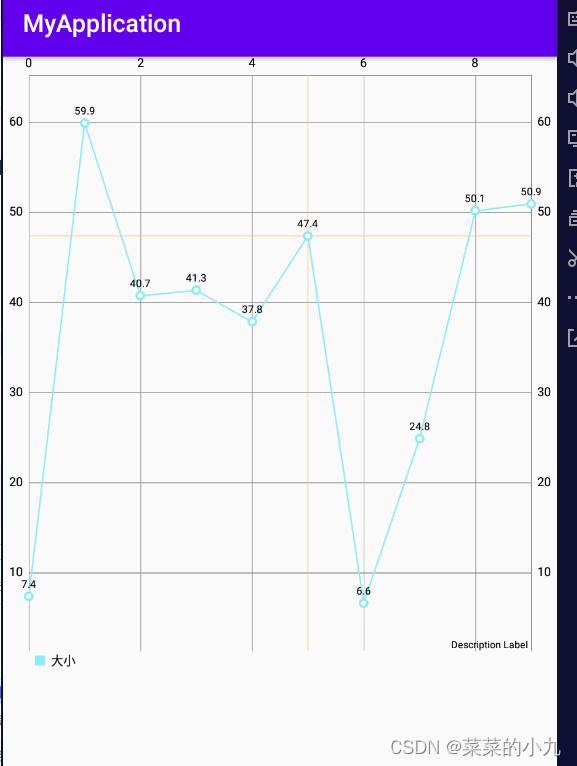
LineDataSet lineDataSet=new LineDataSet(list,"大小");6、将我们得到的数据集设进折线图里面去
LineData data=new LineData(lineDataSet);
line_chart.setData(data);
7、效果展示
二、修改颜色大小
1、修改折线的颜色
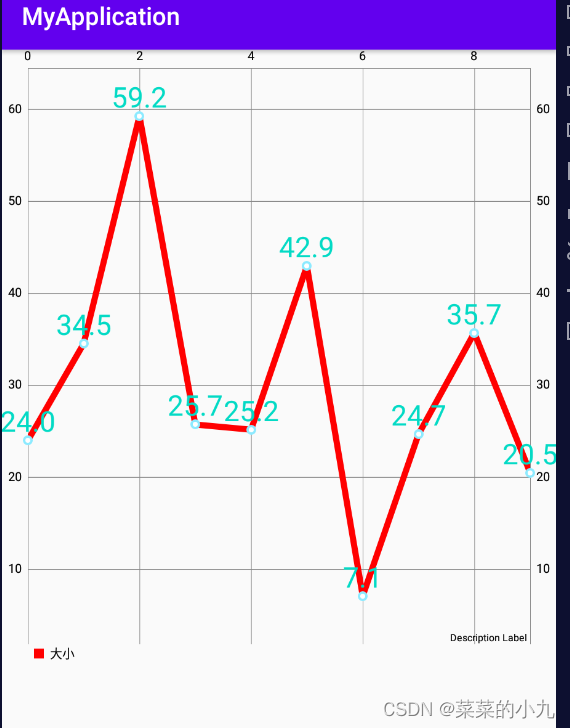
lineDataSet.setColor(Color.RED);2、修改折线宽度
lineDataSet.setLineWidth(5f);3、修改折线处文字的大小(不是坐标上的)
lineDataSet.setValueTextSize(23f);4、修改折线处文字的颜色(不是坐标上的)
lineDataSet.setValueTextColor(getResources().getColor(R.color.colorAccent));5、效果展示
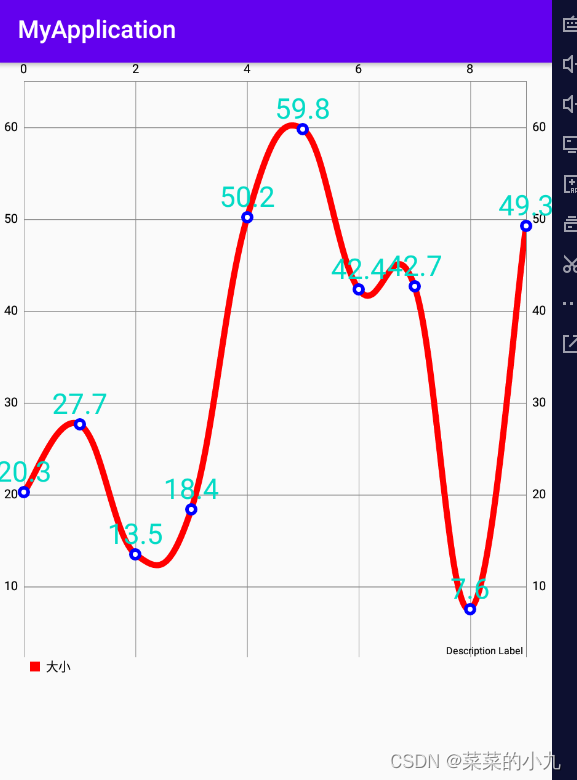
6、设置圆点颜色
lineDataSet.setCircleColor(Color.BULE);7、设置圆点半径大小
lineDataSet.setCircleRadius(5f)8、设置折线模式:直线、圆滑曲线、水平贝塞尔曲线等
lineDataSet.setMode(LineDataSet.Mode.CUBIC_BEZIER);//这里是圆滑曲线9、效果展示
//是否X轴绘制网格线
line_chart.getXAxis().setDrawGridLines(false);
//是否y轴绘制网格线
line_chart.getAxisLeft().setDrawGridLines(false);
line_chart.getAxisRight().setDrawGridLines(false);
//是否绘制右侧轴线
line_chart.getAxisRight().setEnabled(false);
//设置此轴轴线的宽度
line_chart.getXAxis().setAxisLineWidth(0f);
//设置x轴的位置
line_chart.getXAxis().setPosition(XAxis.XAxisPosition.BOTTOM);
//设置轴的最大值
line_chart.getXAxis().setAxisMaximum(10f);
line_chart.getAxisLeft().setAxisMaximum(60f);
//设置轴的最小值
line_chart.getXAxis().setAxisMinimum(0f);
line_chart.getAxisLeft().setAxisMinimum(0f);
//设置x轴标签的角度
line_chart.getXAxis().setLabelRotationAngle(30f);
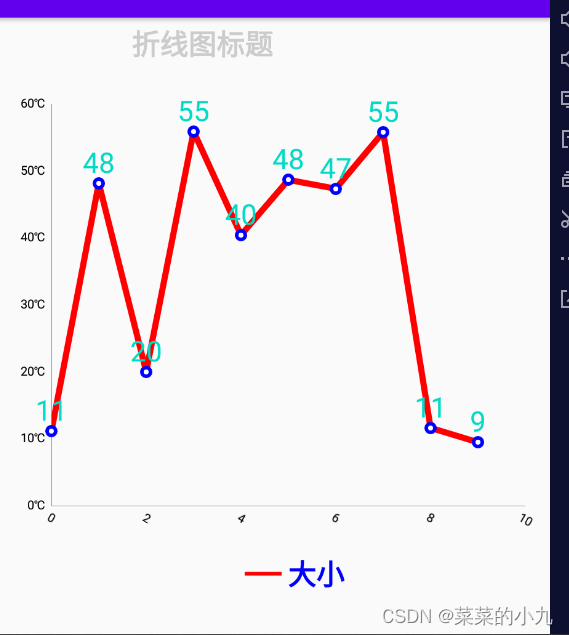
//对y轴内容进行格式化
line_chart.getAxisLeft().setValueFormatter(new ValueFormatter() {
@Override
public String getFormattedValue(float value) {
String newValue=(int)value+"℃";
return newValue;
}
});
//---------------------------------------------设置折线图标题---------------------------------------------------//
Description description=new Description();
description.setText("折线图标题");
description.setTextColor(Color.LTGRAY);description.setTextSize(23f);
description.setTypeface(Typeface.DEFAULT_BOLD);//加粗显示
//设置标题的位置
WindowManager wm= (WindowManager) this.getSystemService(Context.WINDOW_SERVICE);
DisplayMetrics displayMetrics=new DisplayMetrics();
wm.getDefaultDisplay().getMetrics(displayMetrics);
float x=displayMetrics.widthPixels/2;
description.setPosition(x,60);
line_chart.setDescription(description);
//-------------------------------------------------------------------------------------------------------------//
//设置折线图的边距
line_chart.setExtraOffsets(15f,70f,20f,20f);
Legend();
line_chart.animateX(5000); // X轴动画
line_chart.animateY(5000); // Y轴动画
//设置数值格式
lineDataSet.setValueFormatter(new ValueFormatter() {
@Override
public String getFormattedValue(float value) {
String newValue=value+"";
return newValue.substring(0,newValue.indexOf("."));
}
}); private void Legend() {
//对legend的一些设置
//得到legend对象
Legend legend=line_chart.getLegend();
//设置legend的字体颜色
legend.setTextColor(Color.BLUE);
//设置legend的字体大小
legend.setTextSize(23f);
//不绘制在图形内部
legend.setDrawInside(false);
//设置legend字体加粗
legend.setTypeface(Typeface.DEFAULT_BOLD);
//设置图例大小
legend.setFormSize(30f);
//设置图例类型为线条
legend.setForm(Legend.LegendForm.LINE);
//设置图例的位置
legend.setHorizontalAlignment(Legend.LegendHorizontalAlignment.CENTER);
legend.setVerticalAlignment(Legend.LegendVerticalAlignment.BOTTOM);
//设置图例距离底部的位置
legend.setYOffset(20f);
}
效果展示
结语:第一次绘制折线图,有很多属性没有实现,如果我有任何错误或不准确的地方,请各位大佬批评指正,我将非常感激您的帮助。


 5233
5233


 被折叠的 条评论
为什么被折叠?
被折叠的 条评论
为什么被折叠?
 到【灌水乐园】发言


