


上一篇说过了Spring-Cloud 的远程调用方式,微服务领域里Dubbo有自己的熔断降级,这篇就来聊聊Spring-Cloud里的服务熔断降级。
Netflix Hystrix
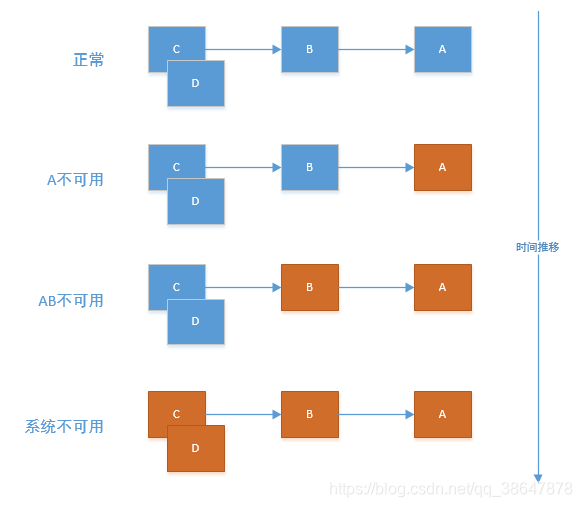
在微服务架构中通常会有多个服务层调用,基础服务的故障可能会导致级联故障,进而造成整个系统不可用的情况,这种现象被称为服务雪崩效应。服务雪崩效应是一种因“服务提供者”的不可用导致“服务消费者”的不可用,并将不可用逐渐放大的过程。
如果下图所示:A作为服务提供者,B为A的服务消费者,C和D是B的服务消费者。A不可用引起了B的不可用,并将不可用像滚雪球一样放大到C和D时,雪崩效应就形成了。
熔断机制就是一个断路器, 当Hystrix Command请求后端服务失败数量超过一定比例(默认50%), 断路器会切换到开路状态(Open). 这时所有请求会直接失败而不会发送到后端服务. 断路器保持在开路状态一段时间后(默认5秒), 自动切换到半开路状态(HALF-OPEN). 这时会判断下一次请求的返回情况, 如果请求成功, 断路器切回闭路状态(CLOSED), 否则重新切换到开路状态(OPEN). Hystrix的断路器就像我们家庭电路中的保险丝, 一旦后端服务不可用, 断路器会直接切断请求链, 避免发送大量无效请求影响系统吞吐量, 并且断路器有自我检测并恢复的能力.
Hystrix还提供了在断路时进行服务降级响应,也即不再走原始逻辑,而是走我们给定的备用方案逻辑,保证服务还能够正常使用而不会直接崩溃。
案例实践
本案例使用Spring-Cloud Hoxton.SR5 版本
本案例我们可以在上一篇的消费者的基础上进行二次修改,之前使用的Feign已经依赖了我们要用的Hystrix。我们只需要在配置文件中启用熔断机制即可。
spring:
  application:
    name: spring-cloud-consumer
server:
  port: 9001
eureka:
  client:
    service-url:
      defaultZone: http://localhost:8000/eureka/
feign:
  hystrix:
    enabled: true
feign.hystrix.enabled=true开启熔断
添加一个hello的降级实现
@Component
public class HelloServiceHystrix implements HelloService {

    @Override
    public String hello(String name) {
        return "hello " + name + ", this message send failed.";
    }
}
还需要在调用的@FeignClient注解的fallback属性里指定降级实现类
@FeignClient(name = "spring-cloud-producer", fallback = HelloServiceHystrix.class)
public interface HelloService {

    @RequestMapping(value = "/hello")
    String hello(@RequestParam(value = "name") String name);
}
测试熔断
依次启动Eureka-Server、Producer、Consumer。
访问http://localhost:9001/hello/hystrix,我们会得到hello hystrix, this is 9000 first message的响应信息。
我们把Producer的服务关掉,再次访问http://localhost:9001/hello/hystrix,我们会得到hello hystrix, this message send failed.的响应信息。
这说明我们的hystrix起作用了,不再走远程调用的逻辑了。
Hystrix Dashboard
Hystrix-dashboard是一款针对Hystrix进行实时监控的工具,通过Hystrix Dashboard我们可以在直观地看到各Hystrix Command的请求响应时间, 请求成功率等数据。
引入依赖
使用这个仪表盘需要引入它的依赖
<dependency>
    <groupId>org.springframework.cloud</groupId>
    <artifactId>spring-cloud-starter-netflix-hystrix</artifactId>
</dependency>
<dependency>
    <groupId>org.springframework.cloud</groupId>
    <artifactId>spring-cloud-starter-netflix-hystrix-dashboard</artifactId>
</dependency>
<dependency>
    <groupId>org.springframework.boot</groupId>
    <artifactId>spring-boot-starter-actuator</artifactId>
</dependency>
开启仪表盘
需要在启动类中添加@EnableCircuitBreaker,@EnableHystrixDashboard这两个注解
@EnableDiscoveryClient
@EnableFeignClients
@SpringBootApplication
@EnableHystrixDashboard
@EnableCircuitBreaker
public class SpringCloudConsumerApplication {

    public static void main(String[] args) {
        SpringApplication.run(SpringCloudConsumerApplication.class, args);
    }

}
在配置文件中开放hystrix的端口,默认只开启了info,health端口。
management:
  endpoints:
    web:
      exposure:
        include: '*'
Hoxton.SR5版本的Spring-Cloud还存在一个网页里的js BUG,会导致仪表盘一直在loding。我们可以把版本改为
Hoxton.RELEASE即可解决这个问题。后续版本应该已经解决了,我用的时候已经修复了这个issue。
官方issue: https://github.com/MadeInChina/spring-cloud-netflix/commit/afc1d989767d0a21524b865dafeebc37d4c78e04
测试仪表盘
依次启动Eureka、Producer、Consumer服务,访问http://localhost:9001/hystrix就能得到如下页面
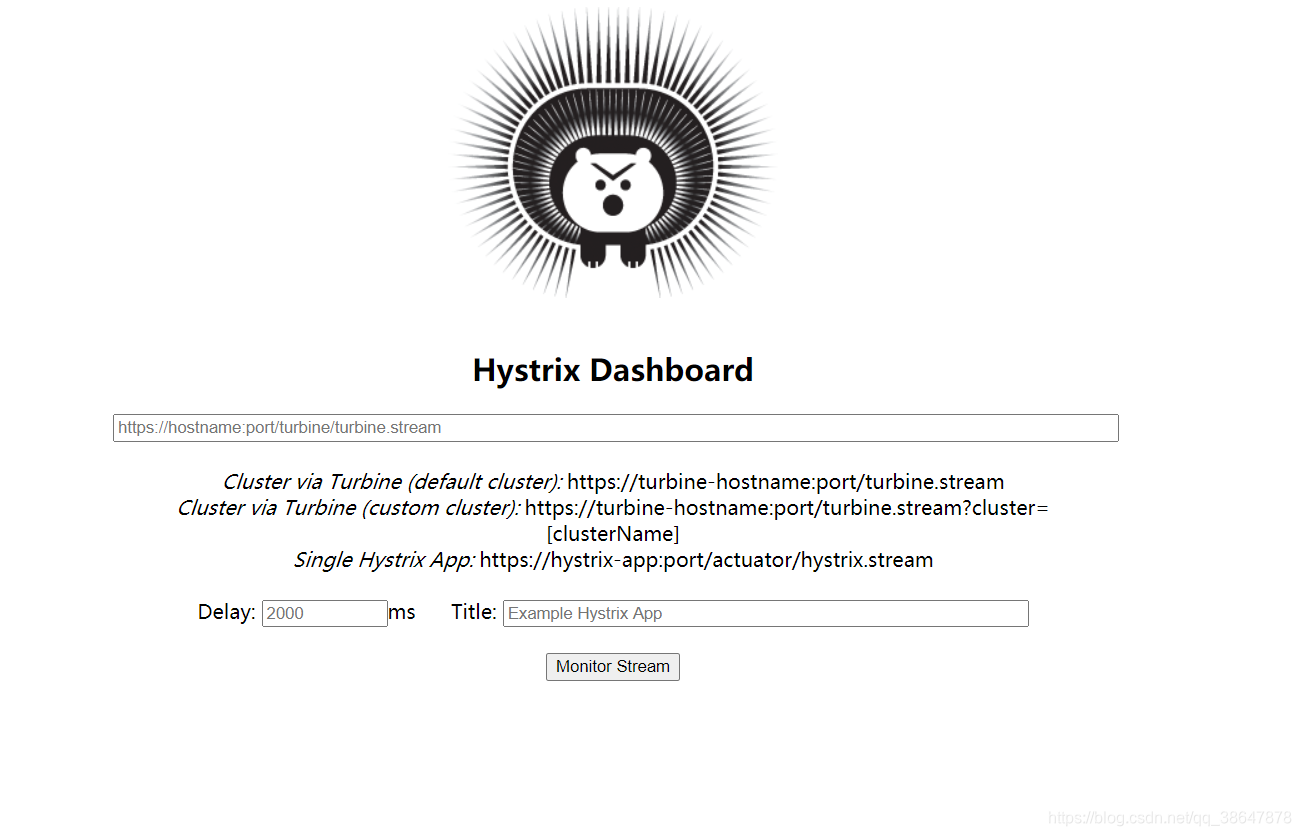
在输入框输入http://localhost:9001/actuator/hystrix.stream,然后点击Monitor Stream按钮就能进入下面的网页
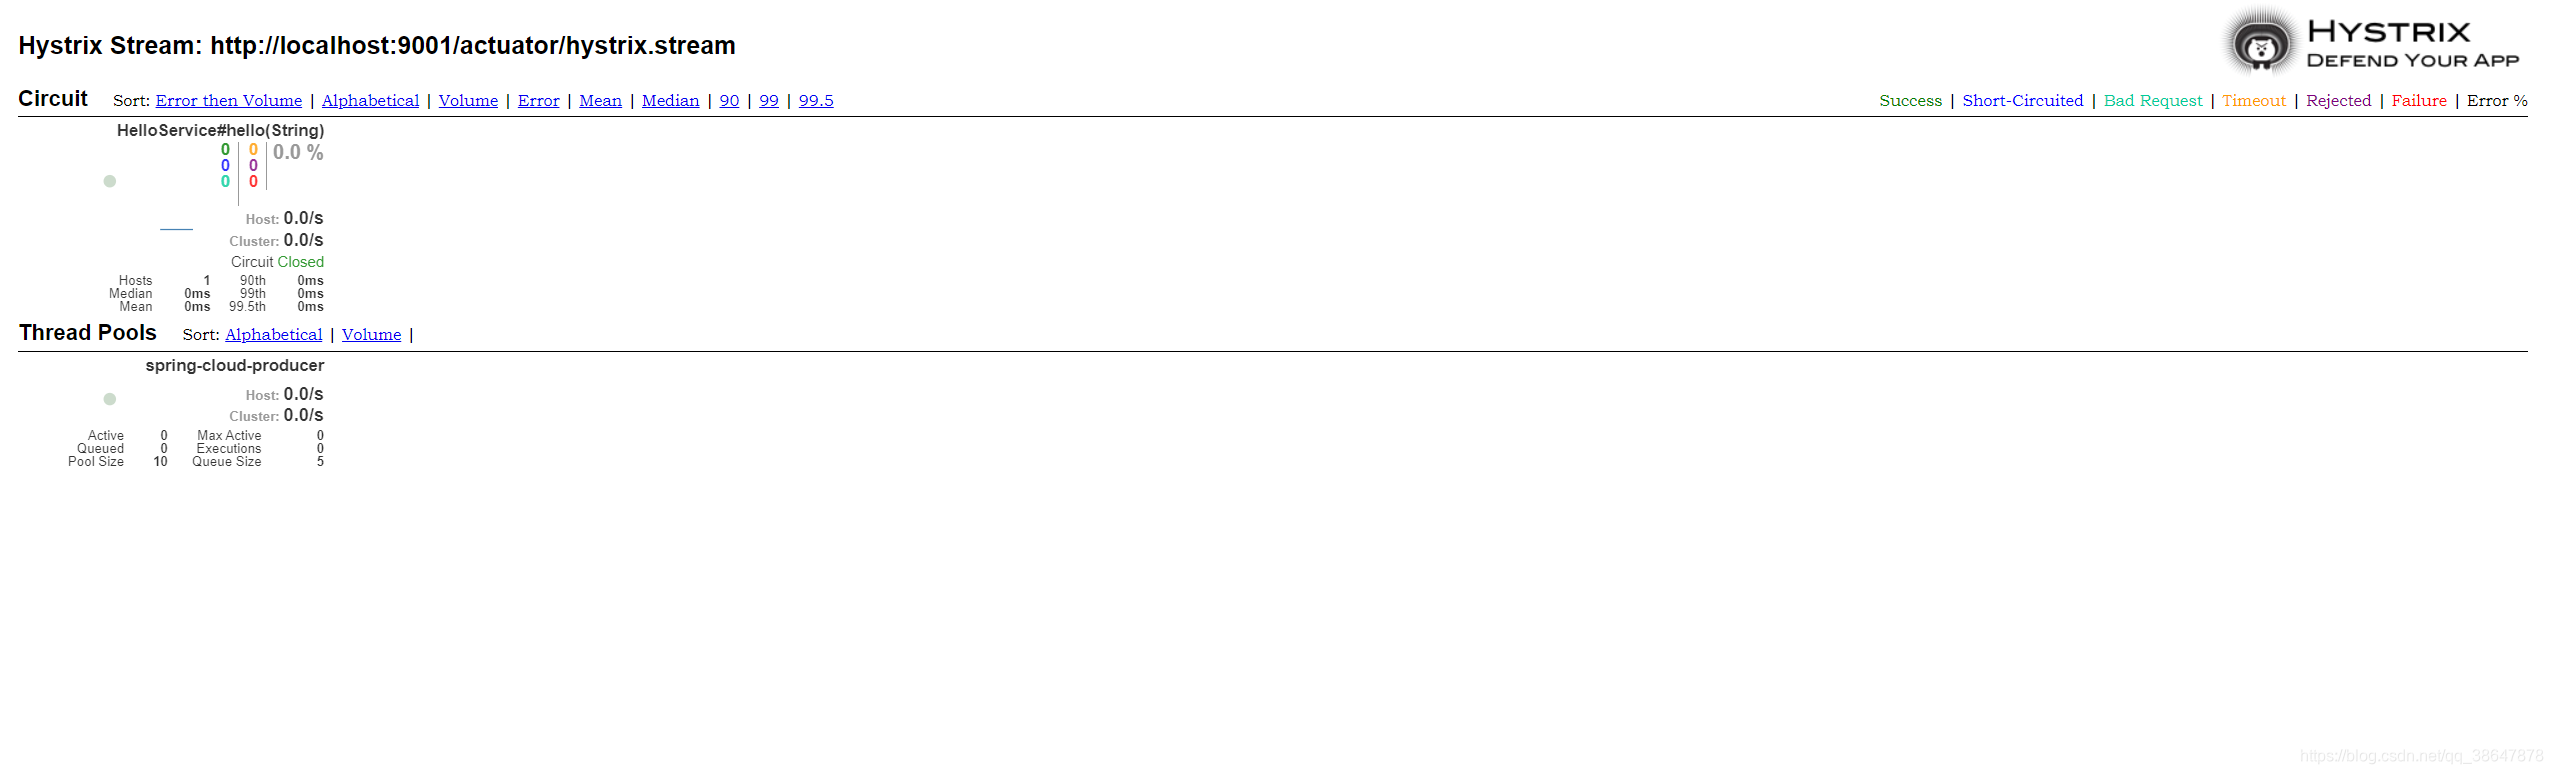
如果你的仪表盘没有上图的数据,是空白的,不用担心,是因为你还没有访问记录。访问几次http://localhost:9001/hello/hystrix,就可以得到这个界面。
监控图中用圆点来表示服务的健康状态,健康度从100%-0%分别会用绿色、黄色、橙色、红色来表示。 另外,这个圆点也会随着流量的增多而变大。 监控图中会用曲线(圆点旁边)来表示服务的流量情况,通过这个曲线可以观察单个接口的流量变化/趋势。
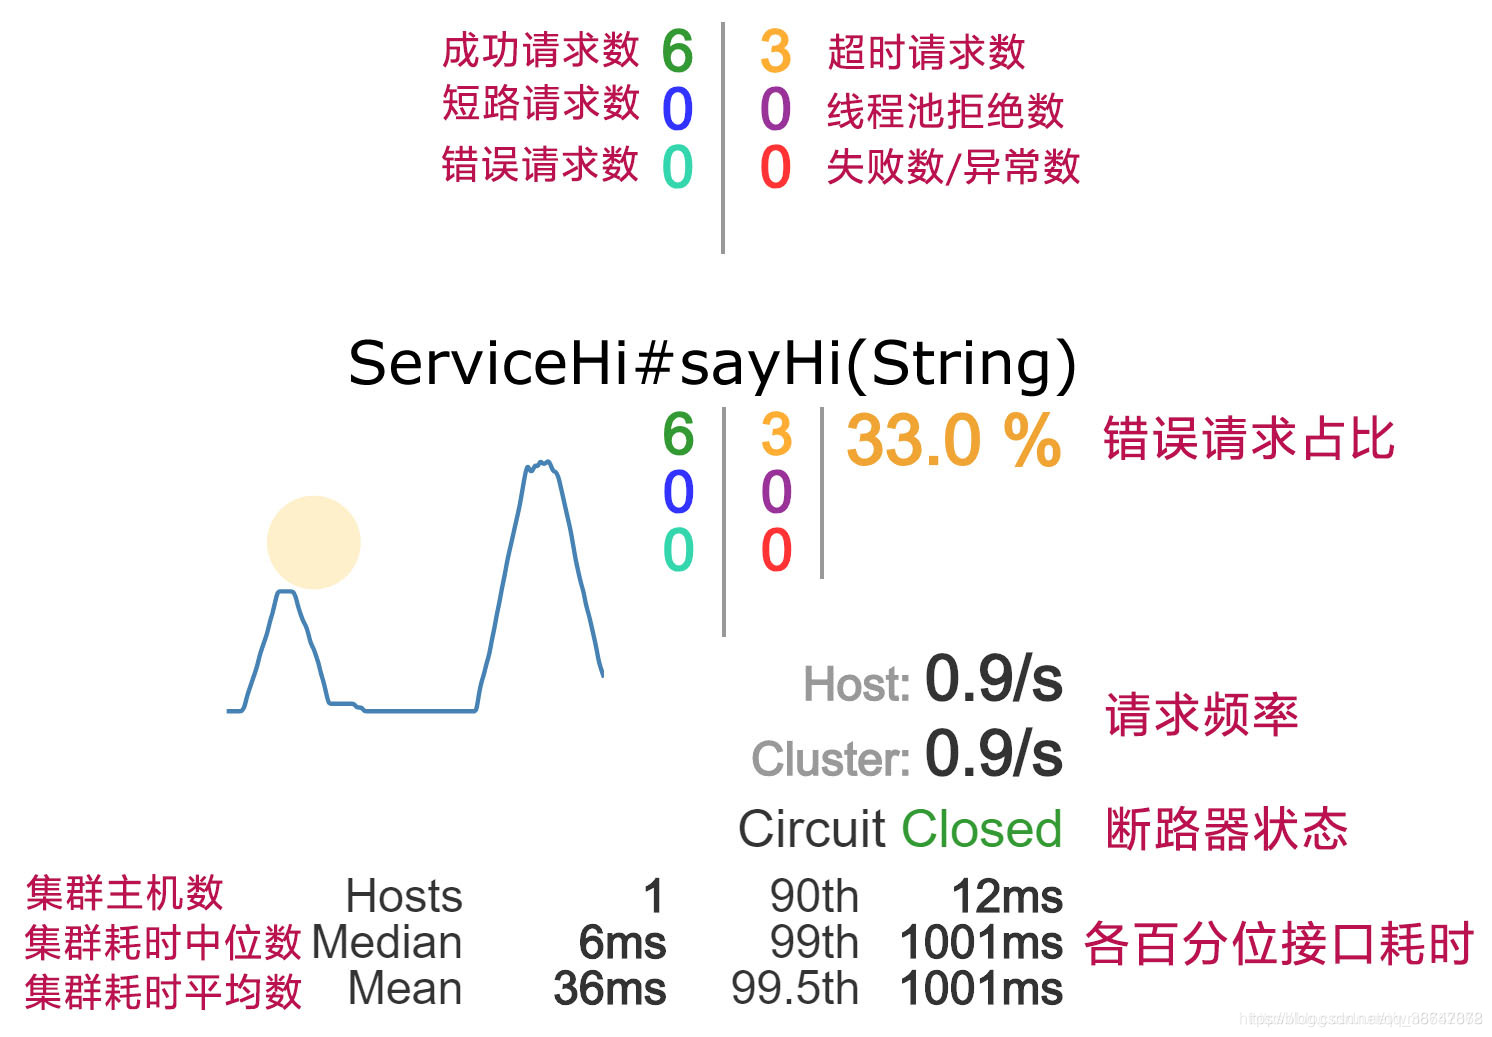
仪表盘指标含义如下图所示
Turbine
只使用Hystrix Dashboard的话, 你只能看到单个应用内的服务信息, 这明显不够。 我们需要一个工具能让我们汇总系统内多个服务的数据并显示到Hystrix Dashboard上, 这个工具就是Turbine。
区别于之前,我又创建了一个spring-cloud-turbine的模块。
引入依赖
版本依然时RELESE的版本。
<properties>
    <java.version>1.8</java.version>
    <spring-cloud.version>Hoxton.RELEASE</spring-cloud.version>
</properties>
<dependency>
    <groupId>org.springframework.cloud</groupId>
    <artifactId>spring-cloud-starter-netflix-hystrix-dashboard</artifactId>
</dependency>
<dependency>
    <groupId>org.springframework.boot</groupId>
    <artifactId>spring-boot-starter-actuator</artifactId>
</dependency>

<dependency>
    <groupId>org.springframework.cloud</groupId>
    <artifactId>spring-cloud-starter-netflix-turbine</artifactId>
</dependency>
<dependency>
    <groupId>org.springframework.cloud</groupId>
    <artifactId>spring-cloud-netflix-turbine</artifactId>
</dependency>
开启熔断器和仪表盘、和集群工具
@EnableHystrixDashboard
@EnableTurbine
@SpringBootApplication
public class SpringCloudTurbineApplication {

    public static void main(String[] args) {
        SpringApplication.run(SpringCloudTurbineApplication.class, args);
    }
}
配置文件
spring:
  application:
    name: hystrix-dashboard-turbine
server:
  port: 8001
turbine:
  app-config: node1,node2
  cluster-name-expression: new String("default")
eureka:
  client:
    serviceUrl:
      defaultZone: http://localhost:8000/eureka/
turbine.app-config:配置Eureka中的serviceId列表,表明监控哪些服务turbine.aggregator.cluster-config:指定聚合哪些集群,多个使用”,”分割,默认为default。可使用http://.../turbine.stream?cluster={clusterConfig之一}访问turbine.cluster-name-expression: 1.cluster-name-expression指定集群名称,默认表达式appName;此时:turbine.aggregator.cluster-config需要配置想要监控的应用名称;2. 当cluster-name-expression: default时,turbine.aggregator.cluster-config可以不写,因为默认就是default;3. 当cluster-name-expression: metadata[‘cluster’]时,假设想要监控的应用配置了eureka.instance.metadata-map.cluster: ABC,则需要配置,同时turbine.aggregator.cluster-config: ABC
测试Turbine
将consumer的配置文件中spring.application.name属性分别改为node1,node2启动,同样端口号也修改为9001,9002。node2的需要修改调用的服务名字以及方法名
@FeignClient(name = "spring-cloud-producer2", fallback = HelloServiceHystrix.class)
public interface HelloService {

    @RequestMapping(value = "/hello")
    String hello2(@RequestParam(value = "name") String name);
}
启动方式参考#idea多实例启动
依次启动Eureka、Producer、consumer1、consumer2、Turbine。
分别访问几次http://localhost:9001/hello/turbine,http://localhost:9002/hello/turbine
访问http://localhost:8001/hystrix,输入http://localhost:8001/turbine.stream,可以得到下图的仪表盘
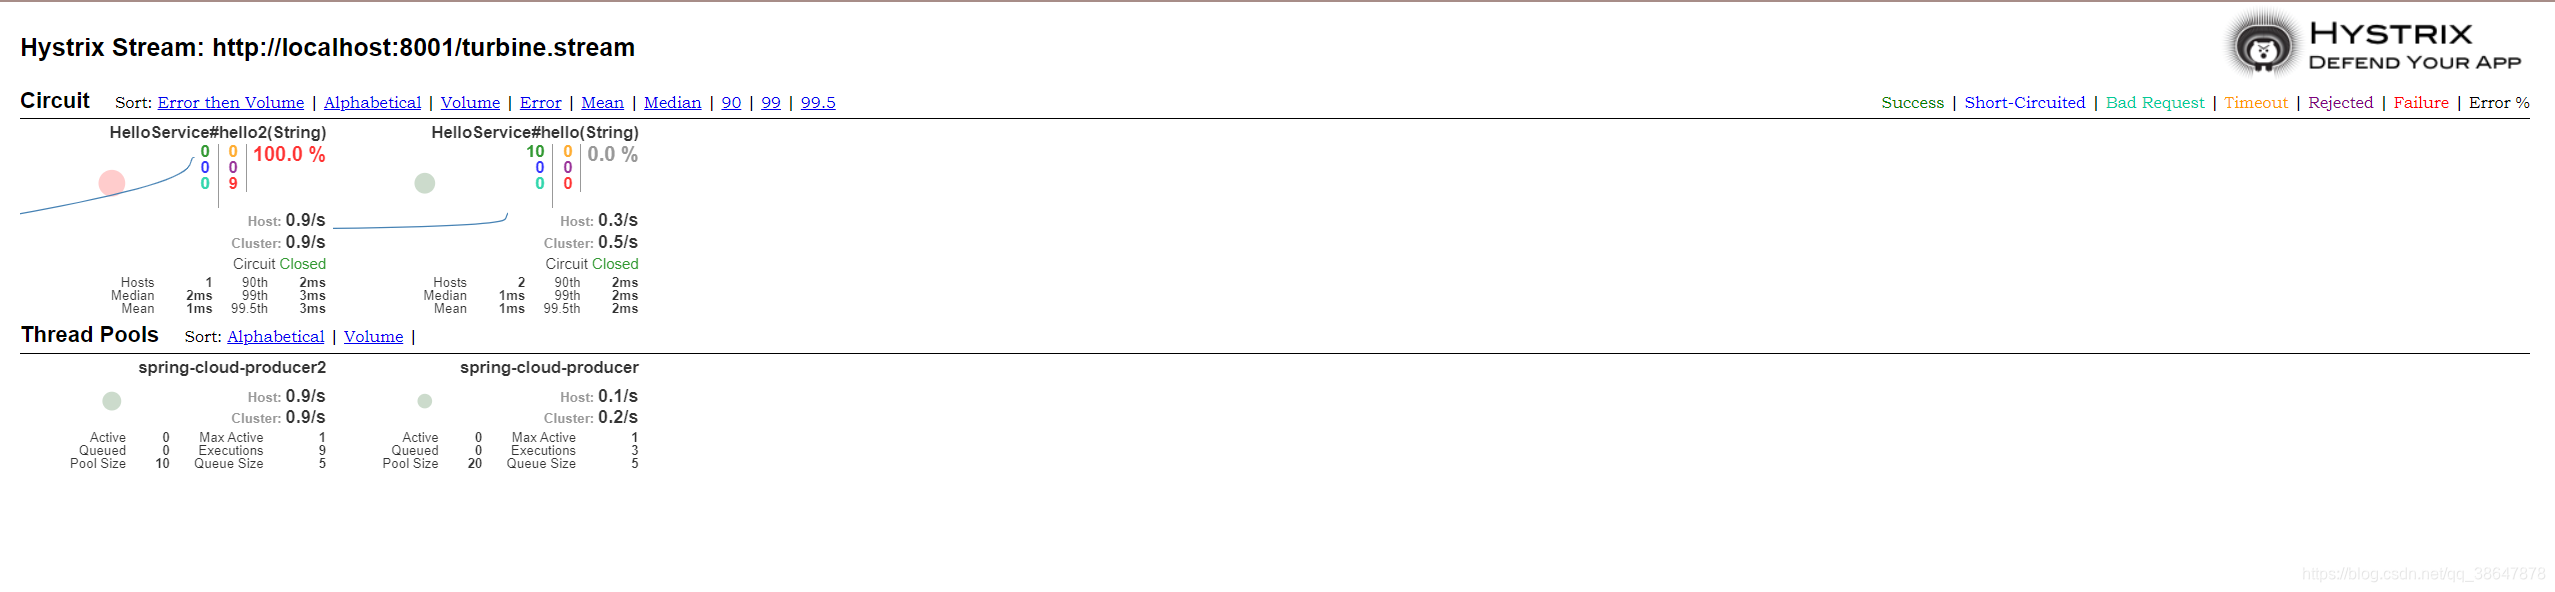
调用hello2的方法由于提供者没有对应的方法,所以一直是断路的状态。
OK,到这里关于熔断器、仪表盘的学习分享就完了。
文章参考
纯洁的微笑:熔断器Hystrix
纯洁的微笑:springcloud(五):熔断监控Hystrix Dashboard和Turbine
贲_WM:仪表盘指标含义
案例源码
运行源码的某一个服务时请将与本节不相关的功能注释掉,避免启动失败。


 1840
1840


 被折叠的 条评论
为什么被折叠?
被折叠的 条评论
为什么被折叠?
 到【灌水乐园】发言


