


   工作需要绘制一张可动态添加的折线图,经过筛选,选择MPAndroidChart:v3.1.0。
   **使用方法:**
1、添加build gradle
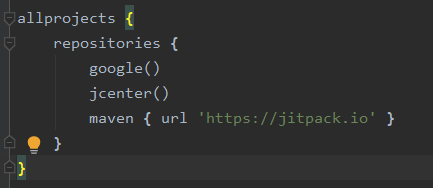
在项目的build gradle中上述位置中添加“maven { url ‘https://jitpack.io’ }”这串代码。
在APP的build gradle的dependencies中添加 implementation 'com.github.PhilJay:MPAndroidChart:v3.1.0’依赖。
在插入折线图的activity中添加如下代码,自行调整位置等。
<com.github.mikephil.charting.charts.LineChart
    android:id="@+id/mChart"
    android:layout_width="match_parent"
    android:layout_height="match_parent"
    android:layout_marginTop="20dp"/>
在项目中新建一个javal类,效果如下图所示:
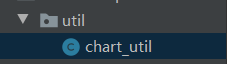
在chart中插入下方的三个方法
 public static void chart_init(LineChart chart)
    {
        //chart.setOnChartValueSelectedListener(this);
        // enable description text
        chart.getDescription().setEnabled(true);
        // enable touch gestures
        chart.setTouchEnabled(true);

        /****************设置描述信息*************/
        Description description =new Description();
        description.setText("氨气浓度(ppm)");
        description.setPosition(700,50);
        description.setTextColor(Color.RED);
        description.setTextSize(15);
        chart.setDescription(description);//设置图表描述信息
        chart.setNoDataText("没有数据熬");//没有数据时显示的文字
        chart.setNoDataTextColor(Color.RED);//没有数据时显示文字的颜色
        chart.setDrawGridBackground(false);//chart 绘图区后面的背景矩形将绘制
        chart.setDrawBorders(false);//绘制图表边框的线
        // enable scaling and dragging
        chart.setDragEnabled(true);
        chart.setScaleEnabled(true);
        chart.setDrawGridBackground(false);

        // if disabled, scaling can be done on x- and y-axis separately
        chart.setPinchZoom(true);

        // set an alternative background color
        //chart.setBackgroundColor(0x4169E1FF);

        LineData data = new LineData();
        data.setValueTextColor(Color.BLACK);

        // add empty data
        chart.setData(data);

        // get the legend (only possible after setting data)
        Legend l = chart.getLegend();

        // modify the legend ...
        l.setForm(Legend.LegendForm.LINE);
        l.setTextColor(Color.BLACK);
        //x轴配置
        XAxis xl = chart.getXAxis();
        //xl.setTypeface(tfLight);
        xl.setTextColor(Color.BLACK);
        xl.setDrawGridLines(false);
        xl.setAvoidFirstLastClipping(true);
        xl.setEnabled(true);
        xl.setPosition(XAxis.XAxisPosition.BOTTOM);//X轴文字显示位置
        //左y轴配置
        YAxis leftAxis = chart.getAxisLeft();
        leftAxis.setTextColor(Color.BLACK);
        leftAxis.setAxisMaximum(30f);
        leftAxis.setAxisMinimum(0f);
        leftAxis.setDrawGridLines(true);
        //右y轴配置
        YAxis rightAxis = chart.getAxisRight();
        rightAxis.setEnabled(false);
    }

    public static void addEntry(LineChart chart, float Concentration_data) {
        LineData data = chart.getData();
        YAxis leftAxis = chart.getAxisLeft();
        if (data != null) {
            ILineDataSet set = data.getDataSetByIndex(0);
            // set.addEntry(...); // can be called as well
            if (set == null) {
                set = createSet();
                data.addDataSet(set);
            }
            if(Concentration_data > -50 && Concentration_data < 100)
            {
                data.addEntry(new Entry(set.getEntryCount(), Concentration_data), 0);
                leftAxis.setAxisMaximum(data.getYMax() + 1);
                leftAxis.setAxisMinimum(data.getYMin() - 1);
            }
            data.notifyDataChanged();
            chart.notifyDataSetChanged();
            chart.setVisibleXRangeMaximum(80);
            chart.moveViewToX(data.getEntryCount());
        }
    }

    private static LineDataSet createSet() {
        LineDataSet set = new LineDataSet(null, "Dynamic Data");
        set.setAxisDependency(YAxis.AxisDependency.LEFT);
        set.setColor(Color.BLACK);
        set.setCircleColor(Color.RED);
        set.setLineWidth(2f);
        set.setCircleRadius(4f);
        set.setFillAlpha(65);
        set.setFillColor(ColorTemplate.getHoloBlue());
        set.setHighLightColor(Color.rgb(244, 117, 117));
        set.setValueTextColor(Color.RED);
        set.setValueTextSize(9f);
        set.setDrawValues(true);
        return set;
    }
在需要折线图的activity中使用方法如下:
package com.example.beebird;

import java.util.Random;
//引用自己添加

public class MainActivity extends AppCompatActivity {

    /*******画图********/
    private LineChart chart;

    private static Thread chartThread;//画图线程

    @Override
    protected void onCreate(Bundle savedInstanceState) {
        super.onCreate(savedInstanceState);
        setContentView(R.layout.activity_main);

        chart = (LineChart) findViewById(R.id.mChart);//获取对象
        chart_util.chart_init(chart);//初始化折线图

        startChart();//启动画图线程
    }
    private void startChart() {

        chartThread = new Thread(new Runnable() {
            @Override
            public void run () {
                Random random = new Random();//默认构造方法
                while (true) {
                    try {
                        Thread.sleep(500);
                    } catch (InterruptedException e) {
                        e.printStackTrace();
                    }
                    float temp_float = (float)((random.nextFloat())*0.2) + 5;//产生一个5.0-5.2的随机数
                    chart_util.addEntry(chart,temp_float);//添加数据点
                }
            }
        });
        /*启动连接线程*/
        chartThread.start();
    }

    /*退出时取消绑定服务以及广播监听*/
    @Override
    protected void onDestroy() {
        super.onDestroy();
    }
}
   在需要动态添加数据的位置使用“addEntry(datatest1);”代码,
   datatest1为float类型的数据。
   效果如下图所示


 939
939


 被折叠的 条评论
为什么被折叠?
被折叠的 条评论
为什么被折叠?
 到【灌水乐园】发言


