


1. 先制作目标精度的流域掩膜(此处使用的ERA5-land数据为0.1°)
tic
[sf,Georeff] = geotiffread('J:\ERA5-monthly-all-1950\tif_version\sf\195001.tif');
% 计算每个栅格中心点的坐标,ERA5-LAND数据是1801x3600,意味着栅格尺寸在南北向为0.0999°,东西向是0.1°
% 则栅格中心点的纬度起止近似为[-89.95:0.09994:89.95],经度起止为[-179.95:1:179.95]
lat_center = 89.95:-0.09994:-89.95;
lon_center = -179.95:0.1:179.95;
% 导入流域边界,需要是个线文件而不是面文件
Boundary = shaperead('F:\Boundary Documents\黄河源\basin_yrsr_WGS1984_line.shp');
Boundary_x = Boundary(2).X;                               %流域边界的纬度
Boundary_y = Boundary(2).Y;                               %流域边界的经度
% 识别0.1°全球网格中流域边界所覆盖的区域
cat_mask_01degree = nan*zeros(length(lat_center),length(lon_center));
for i = 1:length(lat_center)
    for j = 1:length(lon_center)
        [in,on] = inpolygon(lon_center(j),lat_center(i),Boundary_x,Boundary_y);
        if in == 0 && on == 0
            continue
        else
            cat_mask_01degree(i,j) = 1;
        end
    end
end

figure(1)
ax = worldmap([10 60],[70 130]);
geoshow('landareas.shp', 'FaceColor', [0.85 0.85 0.85], 'EdgeColor', [1 1 1],'FaceAlpha',0.5)
geoshow(cat_mask_01degree,Georeff,'DisplayType','surface')
colorbar
toc
save('YR_mask','cat_mask_01degree')
说明:关于上述代码中判断点是否在边界内,请参见MATLAB 判断点(坐标)是否在.shp边界(不规则多边形)范围内

2. 根据掩膜文件 直接计算流域降雪的面平均值
tic
cat_path = 'J:\ERA5-monthly-all-1950\tif_version\sf\';
tif_path = dir([cat_path,'*.tif']);
for i = 1:length(tif_path)
    [sf_global,~] = geotiffread([tif_path(i).folder,'\',tif_path(i).name]);
    sf_global = sf_global.*cat_mask_01degree;
    imagesc(sf_global)

    sf_global = sf_global(:);
    snowfall_YR(i) = mean(sf_global,'omitnan');
end
save('Pre_Snow_data','snowfall_YR')
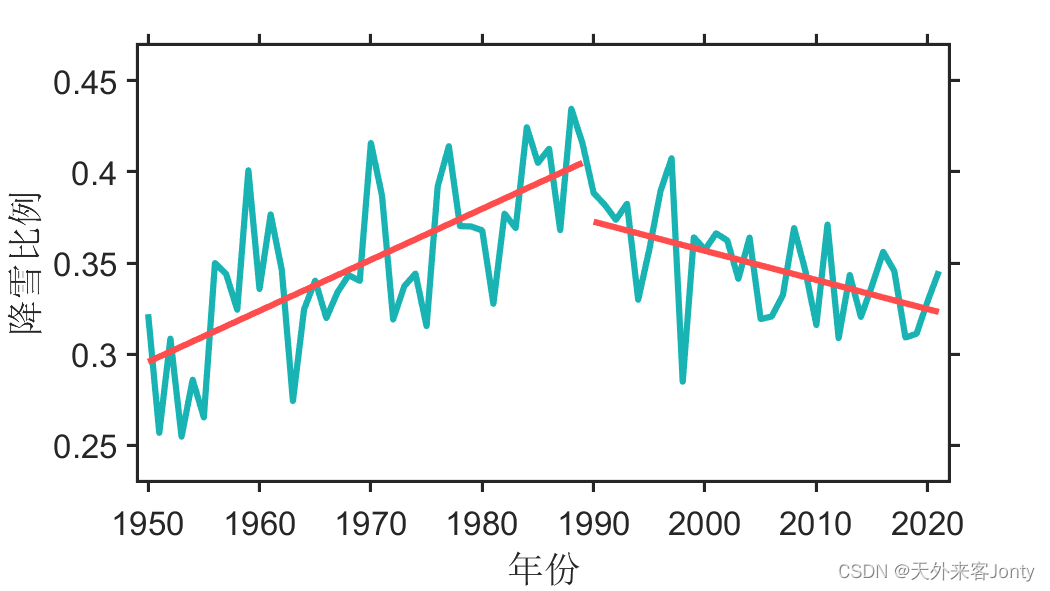
降雪比例数据提取结果如下图所示:


 3722
3722


 被折叠的 条评论
为什么被折叠?
被折叠的 条评论
为什么被折叠?
 到【灌水乐园】发言


