


教程程序使用vue+html5的静态开发
程序直接使用html引用vue.js的方式开发,不依赖node.js和nginx等前端服务器来启动应用,保证程序的效率和降低资源占用成本。
引入echarts,画出graph关系图
教程里面的流程图使用echarts的graph关系图,如下引入echarts.js,然后配置好对应的配置项,即可画出流程图。
<head>
    <!-- 引入 echarts.js -->
    <script src="../../js/echarts/echarts.js"></script>
</head>
<body>
    <div id="main" style="width: 800px;height:800px;"></div>
</body>
// 基于准备好的dom,初始化echarts实例
var myChart = echarts.init(document.getElementById('main'));
myChart.on('click', function (params) {
paramsName = params.name;
popoverTitle = '“'+params.name+'”操作选择';
if(params.dataType == "node") {
currentGridData = tempGridData[params.name];
}
if(params.dataType == "edge") {
currentGridData = tempGridData[params.data.source]==undefined?[]:tempGridData[params.data.source];
currentGridData = currentGridData.concat(tempGridData[params.data.target]==undefined?[]:tempGridData[params.data.target]);
}
currentClickPopover = true;
});
//分类
var categories = [{name: '1',itemStyle:{color: '#333'}},
{name: '2',itemStyle:{color: '#337ab7'}},
{name: '3',itemStyle:{color: '#8f2890'}},
{name: '4',itemStyle:{color: '#a22f02'}},
{name: '5',itemStyle:{color: '#e4b90b'}},
{name: '6',itemStyle:{color: '#0a8e22'}},
{name: '7',itemStyle:{color: '#b20202'}},];
//初始化各个模块节点
var currentData = hospitalization.data;
currentData = currentData.concat(hospitalNurse.data);
currentData = currentData.concat(hospitalDoctor.data);
currentData = currentData.concat(noSystem.data);
//初始化连接线
var currentLinks = hospitalization.links;
currentLinks = currentLinks.concat(publicConnection.links);
// 指定图表的配置项和数据
var option = {
tooltip: {
show: true,
confine: true,
},
toolbox: {
id: 'echartToolBox',
show: true,
top: 20,
right:20,
feature: {
restore: {},
saveAsImage: {}
}
},
animationDurationUpdate: 1500,
animationEasingUpdate: 'quinticInOut',
legend: [{
// selectedMode: 'single',
data: categories.map(function (a) {
return a.name;
})
}],
series : [
{
type: 'graph',
layout: 'none',
symbolSize: 50,
roam: false,
focusNodeAdjacency: true,
categories: categories,
label: {
normal: {
show: true
}
},
edgeSymbol: ['circle', 'arrow'],
edgeSymbolSize: [4, 10],
edgeLabel: {
normal: {
textStyle: {
fontSize: 12
}
}
},
data: currentData,
links: currentLinks,
lineStyle: {
normal: {
color: 'source',
opacity: 0.9,
width: 2,
curveness: 0
}
},
emphasis: {
lineStyle: {
width: 20
}
}
}
]
};
// 使用刚指定的配置项和数据显示图表。
myChart.setOption(option);效果如下_:

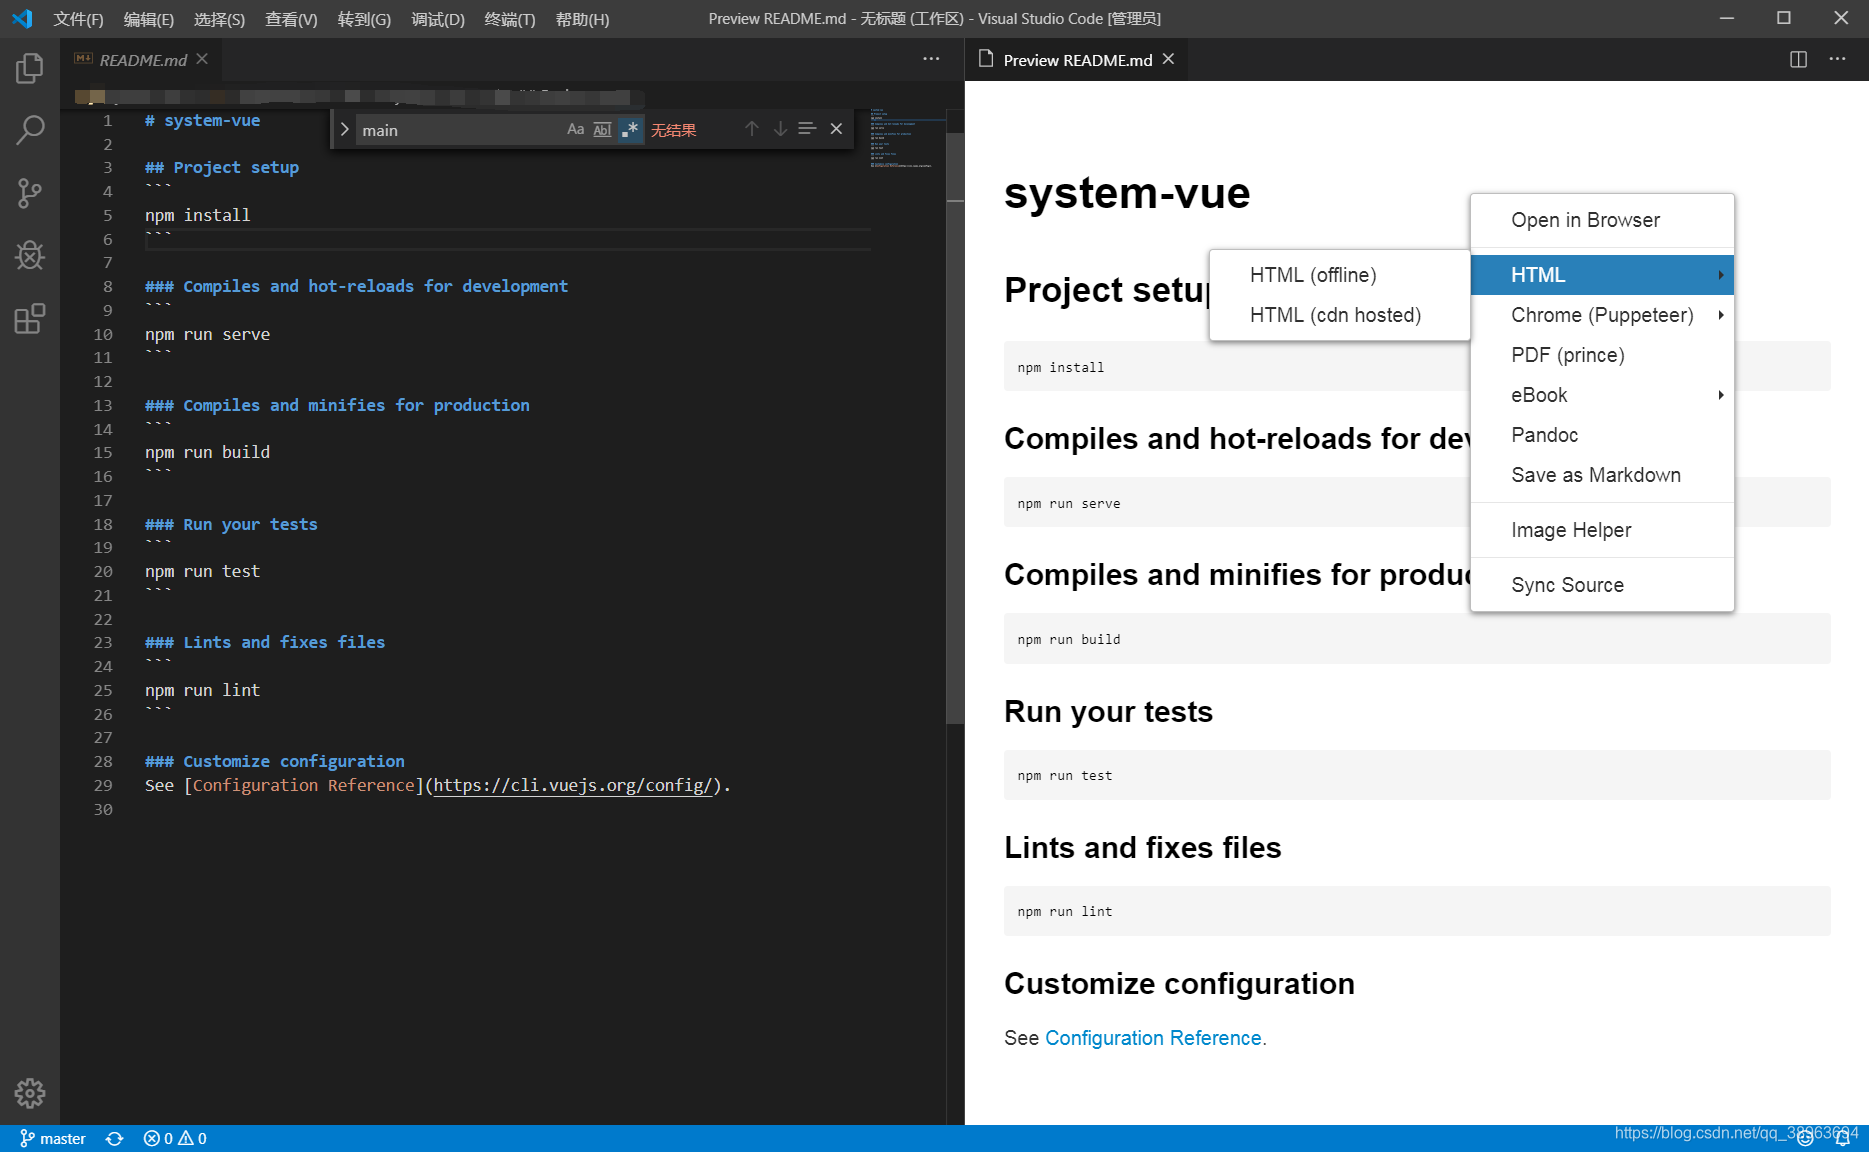
使用vscode编写markdown,尔后转为html
这里推荐vscode的几个markdown插件,非常好用:
-
Markdown Preview Enhanced
-
Markdown Preview Mermaid Support
使用vue+element在iframe包装html,做成文档

使用nwjs封装成exe
nwjs推荐参考网址:【NWjs中文网】 - nw.js跨平台技术,使用JavaScript,HTML以及CSS搭建跨平台桌面应用
配置一下main.js和package.json
main.js:
// 初始化你的应用程序之后 ...
nw.Window.open('index.html', {}, function(win) {});
package.json
{
  "main": "index.html",
  "name": "graph",
  "version": "0.0.1",
  "keywords": [ "graph", "Cloud" ],
  "description": "Cloud hospital process display",
  "window": {
    "title": "教程",
    "icon": "process.png",
    "toolbar": false,
    "frame": true,
    "width": 800,
    "height": 500,
    "position": "center",
    "min_width": 800,
    "min_height": 500,
    "max_width": null,
    "max_height": null,
    "as_desktop" :false,
    "resizable":true,
    "always-on-top":false,
    "fullscreen":false,
    "show_in_taskbar":true,
    "show":true,
    "kiosk":false
  },
  "webkit": {
    "plugin": true,
    "java":false,
    "page-cache":true
  },
  "chromium-args" :"-allow-file-access-from-files"
}
将项目放在package.nw目录上

执行一下命令提示符的生成exe脚本,即可完成exe封装
copy /b /y nw.exe+package.nw app.exe如果想生成单独一个exe文件,可以使用打包工具“Enigma Virtual Box”。


 483
483


 被折叠的 条评论
为什么被折叠?
被折叠的 条评论
为什么被折叠?
 到【灌水乐园】发言


