


 本文档展示了一个Java工具类`GeneratePieChartUtil`,该类用于利用JFreeChart库创建标准饼图和3D饼图。工具类提供了多个静态方法,接受图表标题、图例名、数据、尺寸、主题、颜色等参数,返回JFreeChart对象或直接输出到OutputStream。示例代码展示了如何通过这个工具类生成饼图和3D饼图,并在HTTP响应中输出。
1 Maven依赖
       <!-- Hutool工具包 -->
        <dependency>
            <groupId>cn.hutool</groupId>
            <artifactId>hutool-all</artifactId>
            <version>5.6.2</version>
        </dependency>
        <!-- JFreeChart图表库 -->
        <dependency>
            <groupId>org.jfree</groupId>
            <artifactId>jfreechart</artifactId>
            <version>1.5.3</version>
        </dependency>
2 GeneratePieChartUtil
饼图生成工具类。
package com.jfreechart;

import cn.hutool.core.collection.CollectionUtil;
import org.jfree.chart.ChartFactory;
import org.jfree.chart.ChartUtils;
import org.jfree.chart.JFreeChart;
import org.jfree.chart.StandardChartTheme;
import org.jfree.chart.block.BlockBorder;
import org.jfree.chart.plot.PieLabelLinkStyle;
import org.jfree.chart.plot.PiePlot;
import org.jfree.chart.plot.PiePlot3D;
import org.jfree.chart.ui.RectangleEdge;
import org.jfree.chart.util.Rotation;

import java.awt.*;
import java.io.ByteArrayOutputStream;
import java.io.IOException;
import java.io.OutputStream;
import java.util.List;

/**
 * 饼图生成工具类
 */
public class GeneratePieChartUtil {
    /**
     * 生成饼图(返回JFreeChart)
     *
     * @param chartTitle         图表标题
     * @param legendNameList     图例名称列表
     * @param dataList           数据列表
     * @param theme              主题(null代表默认主题)
     * @param legendColorList    图例背景颜色列表(为空,使用默认背景颜色)
     * @param explodePercentList 偏离百分比数据
     * @return
     */
    public static JFreeChart createPieChart(String chartTitle, List<String> legendNameList, List<Object> dataList, StandardChartTheme theme
            , List<Color> legendColorList, List<Double> explodePercentList) {
        //设置主题,防止中文乱码
        theme = theme == null ? JFreeChartUtil.createChartTheme("") : theme;
        ChartFactory.setChartTheme(theme);
        //创建饼图
        JFreeChart chart = ChartFactory.createPieChart(chartTitle, JFreeChartUtil.createDefaultPieDataset(legendNameList, dataList));
        // 设置抗锯齿,防止字体显示不清楚
        chart.setTextAntiAlias(false);
        PiePlot piePlot = (PiePlot) chart.getPlot();
        //边框线为白色
        piePlot.setOutlinePaint(Color.white);
        //连接线类型为直线
        piePlot.setLabelLinkStyle(PieLabelLinkStyle.QUAD_CURVE);
        // 对饼图进行渲染
        JFreeChartUtil.setPieRender(chart.getPlot());
        // 设置标注无边框
        chart.getLegend().setFrame(new BlockBorder(Color.WHITE));
        // 标注位于右侧
        chart.getLegend().setPosition(RectangleEdge.RIGHT);

        //设置图例背景颜色(饼图)
        if (CollectionUtil.isNotEmpty(legendColorList)) {
            for (int i = 0; i < legendNameList.size() && i < legendColorList.size(); i++) {
                Color color = legendColorList.get(i);
                if (color == null) {
                    continue;
                }
                piePlot.setSectionPaint(legendNameList.get(i), color);
            }
        }
        //设置偏离百分比
        if (CollectionUtil.isNotEmpty(explodePercentList)) {
            for (int i = 0; i < legendNameList.size() && i < explodePercentList.size(); i++) {
                piePlot.setExplodePercent(legendNameList.get(i), explodePercentList.get(i));
            }
        }
        return chart;
    }

    /**
     * 生成饼图(返回byte[])
     *
     * @param chartTitle         图表标题
     * @param legendNameList     图例名称列表
     * @param dataList           数据列表
     * @param width              宽度
     * @param height             高度
     * @param theme              主题(null代表默认主题)
     * @param legendColorList    图例背景颜色列表(为空,使用默认背景颜色)
     * @param explodePercentList 偏离百分比数据
     * @return
     */
    public static byte[] createPieChart(String chartTitle, List<String> legendNameList, List<Object> dataList, int width, int height
            , StandardChartTheme theme, List<Color> legendColorList, List<Double> explodePercentList) {
        ByteArrayOutputStream bas = new ByteArrayOutputStream();
        createPieChart(bas, chartTitle, legendNameList, dataList, width, height, theme, legendColorList, explodePercentList);
        byte[] byteArray = bas.toByteArray();
        return byteArray;
    }

    /**
     * 生成饼图(返回outputStream)
     *
     * @param outputStream       输出流
     * @param chartTitle         图表标题
     * @param legendNameList     图例名称列表
     * @param dataList           数据列表
     * @param width              宽度
     * @param height             高度
     * @param theme              主题(null代表默认主题)
     * @param legendColorList    图例背景颜色列表(为空,使用默认背景颜色)
     * @param explodePercentList 偏离百分比数据
     * @return
     */
    public static void createPieChart(OutputStream outputStream, String chartTitle, List<String> legendNameList, List<Object> dataList
            , int width, int height, StandardChartTheme theme, List<Color> legendColorList, List<Double> explodePercentList) {
        JFreeChart chart = createPieChart(chartTitle, legendNameList, dataList, theme, legendColorList, explodePercentList);
        try {
            ChartUtils.writeChartAsJPEG(outputStream, 1.0f, chart, width, height, null);
        } catch (IOException e) {
            e.printStackTrace();
        }
    }

    /**
     * 生成3D饼图(返回JFreeChart)
     *
     * @param chartTitle      图表标题
     * @param legendNameList  图例名称列表
     * @param dataList        数据列表
     * @param theme           主题(null代表默认主题)
     * @param alpha           0.5F为半透明,1为不透明,0为全透明
     * @param legendColorList 图例背景颜色列表(为空,使用默认背景颜色)
     * @return
     */
    public static JFreeChart create3DPieChart(String chartTitle, List<String> legendNameList, List<Object> dataList, StandardChartTheme theme
            , float alpha, List<Color> legendColorList) {
        //设置主题,防止中文乱码
        theme = theme == null ? JFreeChartUtil.createChartTheme("") : theme;
        ChartFactory.setChartTheme(theme);
        //创建饼图
        JFreeChart chart = ChartFactory.createPieChart3D(chartTitle, JFreeChartUtil.createDefaultPieDataset(legendNameList, dataList)
                , true, true, true);
        // 设置抗锯齿,防止字体显示不清楚
        chart.setTextAntiAlias(false);
        // 设置标注无边框
        chart.getLegend().setFrame(new BlockBorder(Color.WHITE));
        // 标注位于右侧
        chart.getLegend().setPosition(RectangleEdge.RIGHT);
        PiePlot3D pieplot3d = (PiePlot3D) chart.getPlot();
        //设置方向为”顺时针方向“
        pieplot3d.setDirection(Rotation.CLOCKWISE);
        //设置透明度,0.5F为半透明,1为不透明,0为全透明
        pieplot3d.setForegroundAlpha(alpha);
        //边框线为白色
        pieplot3d.setOutlinePaint(Color.white);
        //连接线类型为直线
        pieplot3d.setLabelLinkStyle(PieLabelLinkStyle.QUAD_CURVE);
        //设置图例背景颜色(饼图)
        if (CollectionUtil.isNotEmpty(legendColorList)) {
            for (int i = 0; i < legendNameList.size() && i < legendColorList.size(); i++) {
                pieplot3d.setSectionPaint(legendNameList.get(i), legendColorList.get(i));
            }
        }
        // 对饼图进行渲染
        JFreeChartUtil.setPieRender(chart.getPlot());
        return chart;
    }

    /**
     * 生成3D饼图(返回byte[])
     *
     * @param chartTitle      图表标题
     * @param legendNameList  图例名称列表
     * @param dataList        数据列表
     * @param width           宽度
     * @param height          高度
     * @param theme           主题(null代表默认主题)
     * @param alpha           0.5F为半透明,1为不透明,0为全透明
     * @param legendColorList 图例背景颜色列表(为空,使用默认背景颜色)
     * @return
     */
    public static byte[] create3DPieChart(String chartTitle, List<String> legendNameList, List<Object> dataList, int width, int height
            , StandardChartTheme theme, float alpha, List<Color> legendColorList) {
        ByteArrayOutputStream bas = new ByteArrayOutputStream();
        create3DPieChart(bas, chartTitle, legendNameList, dataList, width, height, theme, alpha, legendColorList);
        byte[] byteArray = bas.toByteArray();
        return byteArray;
    }

    /**
     * 生成3D饼图(返回outputStream)
     *
     * @param outputStream    输出流
     * @param chartTitle      图表标题
     * @param legendNameList  图例名称列表
     * @param dataList        数据列表
     * @param width           宽度
     * @param height          高度
     * @param theme           主题(null代表默认主题)
     * @param alpha           0.5F为半透明,1为不透明,0为全透明
     * @param legendColorList 图例背景颜色列表(为空,使用默认背景颜色)
     * @return
     */
    public static void create3DPieChart(OutputStream outputStream, String chartTitle, List<String> legendNameList, List<Object> dataList
            , int width, int height, StandardChartTheme theme, float alpha, List<Color> legendColorList) {
        JFreeChart chart = create3DPieChart(chartTitle, legendNameList, dataList, theme, alpha, legendColorList);
        try {
            ChartUtils.writeChartAsJPEG(outputStream, 1.0f, chart, width, height, null);
        } catch (IOException e) {
            e.printStackTrace();
        }
    }
}
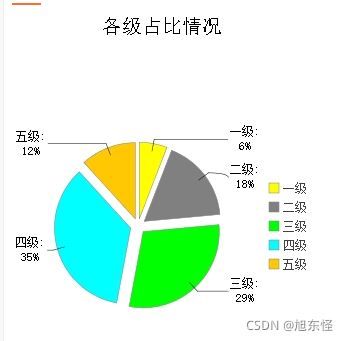
3 标准饼图
3.1 调试代码
    /**
     * 饼图
     *
     * @param response
     */
    @GetMapping("/pieChart")
    public void pieChart(HttpServletResponse response) throws IOException {
        //图例名称列表
        List<String> legendNameList = new ArrayList<>(Arrays.asList("一级", "二级", "三级", "四级", "五级"));
        //数据列表
        List<Object> dataList = new ArrayList<>(Arrays.asList(1, 3, 5, 6, 2));
        //图例背景颜色列表
        List<Color> legendColorList = new ArrayList<>(Arrays.asList(Color.YELLOW, Color.GRAY, Color.green, Color.cyan, Color.ORANGE));
        //偏离百分比数据
        List<Double> explodePercentList = new ArrayList<>(Arrays.asList(0.1, 0.1, 0.1, 0.1, 0.1));
        GeneratePieChartUtil.createPieChart(response.getOutputStream(), "各级占比情况", legendNameList, dataList
                , 300, 400, JFreeChartUtil.createChartTheme("宋体"), legendColorList, explodePercentList);
    }
3.2 调试结果
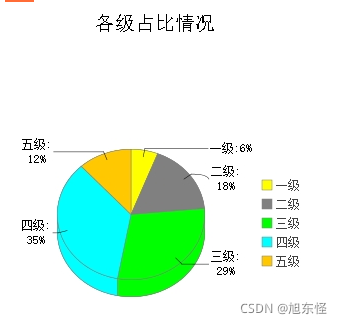
4 3D饼图
4.1 调试代码
    /**
     * 3D饼图
     *
     * @param response
     */
    @GetMapping("/pie3DChart")
    public void pie3DChart(HttpServletResponse response) throws IOException {
        //图例名称列表
        List<String> legendNameList = new ArrayList<>(Arrays.asList("一级", "二级", "三级", "四级", "五级"));
        //数据列表
        List<Object> dataList = new ArrayList<>(Arrays.asList(1, 3, 5, 6, 2));
        //图例背景颜色列表
        List<Color> legendColorList = new ArrayList<>(Arrays.asList(Color.YELLOW, Color.GRAY, Color.green, Color.cyan, Color.ORANGE));
        GeneratePieChartUtil.create3DPieChart(response.getOutputStream(), "各级占比情况", legendNameList, dataList
                , 300, 400, JFreeChartUtil.createChartTheme("宋体"), 1f, legendColorList);
    }
4.2 调试结果
注:
有关JFreeChartUtil的源码,请查看以下博客。
 https://blog.csdn.net/qq_38974638/article/details/118704969


 2179
2179

 被折叠的 条评论
为什么被折叠?
被折叠的 条评论
为什么被折叠?
 到【灌水乐园】发言


