vue-element项目使用echarts(折线图)
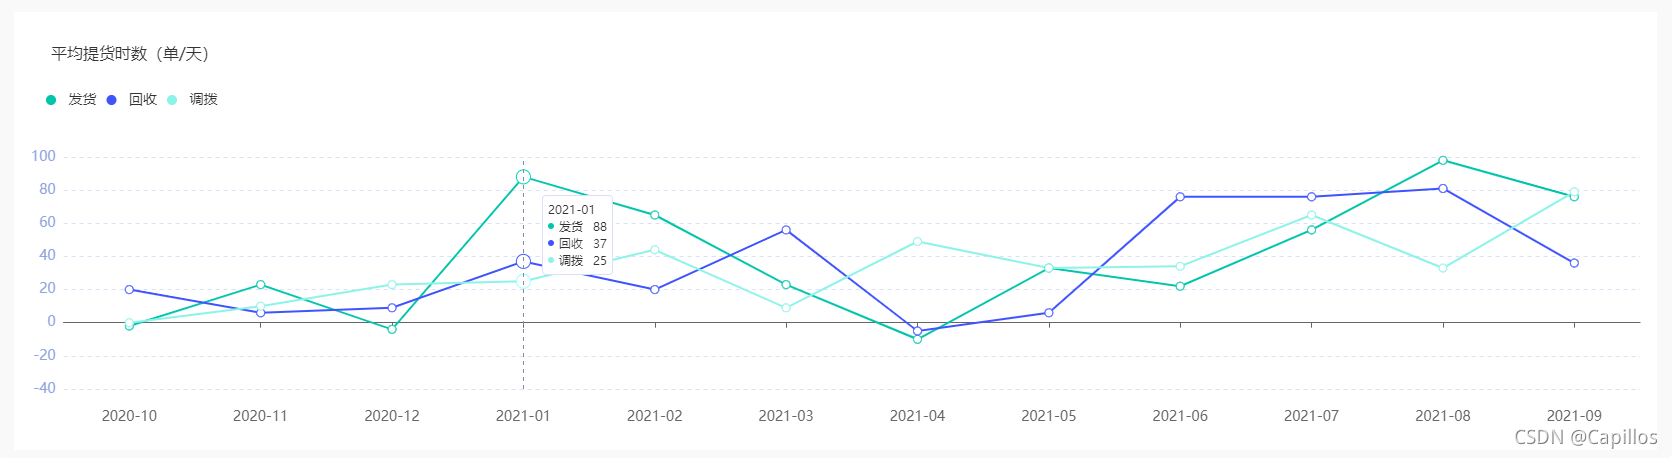
ui设计图

实现
安装echarts
- npm install echarts --save
- 在min.js里配置
// 引入echarts
import echarts from ‘echarts’
Vue.prototype.$echarts = echarts
项目中使用
<template>
<div class="chartLine_wrap">
<div id="myChart" :style="{ width: '100%', height: '438px' }"></div>
</div>
</template>
<script>
import * as echarts from "echarts";
require("echarts/theme/macarons");
export default {
name: "hello",
data() {
return {
a: [],
b: [],
c: [],
date: [],
};
},
mounted() {
this.searchData();
},
methods: {
searchData() {
let data = [
{ year: "2020-10", a: "-2", b: "20", c: "0" },
{ year: "2020-11", a: "23", b: "6", c: "10" },
{ year: "2020-12", a: "-4", b: "9", c: "23" },
{ year: "2021-01", a: "88", b: "37", c: "25" },
{ year: "2021-02", a: "65", b: "20", c: "44" },
{ year: "2021-03", a: "23", b: "56", c: "9" },
{ year: "2021-04", a: "-10", b: "-5", c: "49" },
{ year: "2021-05", a: "33", b: "6", c: "33" },
{ year: "2021-06", a: "22", b: "76", c: "34" },
{ year: "2021-07", a: "56", b: "76", c: "65" },
{ year: "2021-08", a: "98", b: "81", c: "33" },
{ year: "2021-09", a: "76", b: "36", c: "79" },
];
this.date = data.map((i) => {
return i.year;
});
this.a = data.map((i) => {
return i.a;
});
this.b = data.map((i) => {
return i.b;
});
this.c = data.map((i) => {
return i.c;
});
this.drawLine();
},
drawLine() {
let myChart = this.$echarts.init(document.getElementById("myChart"));
myChart.setOption({
title: {
text: "平均提货时数(单/天)",
top: "30",
left: "32",
textStyle: {
fontSize: 16,
color: "#333",
fontWeight: "500",
},
},
tooltip: {
trigger: "axis",
axisPointer: {
type: "line",
lineStyle: {
type: "dashed",
color: "#808BA9",
},
},
backgroundColor: "#fff",
color: "#333",
borderWidth: "1",
borderColor: "#D9E1F8",
textStyle: {
color: "#333",
fontSize: "12",
lineHeight: "17",
},
formatter: function(arg) {
return (
arg[0].name +
"<br>" +
'<span style="margin:0 5px 2px 0;display:inline-block;width:6px;height:6px;border-radius:5px;background-color:' +
arg[0].color +
';"></span>' +
arg[0].seriesName +
'<span style="margin-left:10px;">' +
arg[0].data +
"</span>" +
"<br>" +
'<span style="margin:0 5px 2px 0;display:inline-block;width:6px;height:6px;border-radius:5px;background-color:' +
arg[1].color +
';"></span>' +
arg[1].seriesName +
'<span style="margin-left:10px;">' +
arg[1].data +
"</span>" +
"<br>" +
'<span style="margin:0 5px 2px 0;display:inline-block;width:6px;height:6px;border-radius:5px;background-color:' +
arg[2].color +
';"></span>' +
arg[2].seriesName +
'<span style="margin-left:10px;">' +
arg[2].data +
"</span>"
);
},
},
legend: {
icon: "circle",
itemHeight: 10,
textStyle: {
fontSize: 14,
color: "#333",
},
x: "left",
y: "top",
padding: [81, 0, 0, 32],
},
grid: {
top: "145",
left: "17",
right: "17",
bottom: "41",
containLabel: true,
},
xAxis: {
type: "category",
data: this.date,
axisTick: {
alignWithLabel: true,
},
axisLine: {
lineStyle: {
color: "#666",
width: "1",
},
},
axisLabel: {
formatter(val) {
return "{a|" + `${val}` + "}";
},
rich: {
a: {
height: 40,
color: "#666",
fontSize: 14,
},
},
},
},
yAxis: {
type: "value",
axisLine: {
show: false,
},
axisTick: {
show: false,
},
boundaryGap: [0.1, 0],
splitLine: {
show: true,
lineStyle: {
type: "dashed",
color: "#D9E1F8",
},
},
axisLabel: {
textStyle: {
fontSize: 14,
color: "#92A5E3",
},
},
},
series: [
{
name: "发货",
type: "line",
data: this.a,
color: "#00C5AB",
symbolSize: 8,
},
{
name: "回收",
type: "line",
data: this.b,
color: "#3F53FF",
symbolSize: 8,
},
{
name: "调拨",
type: "line",
data: this.c,
color: "#8DF3E8",
symbolSize: 8,
},
],
});
},
},
};
</script>
<style lang="scss" scoped>
.chartLine_wrap {
width: auto;
height: 438px;
background: #fff;
}
</style>
效果图


 1663
1663


 被折叠的 条评论
为什么被折叠?
被折叠的 条评论
为什么被折叠?
 到【灌水乐园】发言


