


一、背景
Prometheus是由SoundCloud开发的开源监控系统,由GO语言编写而成,采用Pull的方式来获取监控信息,并且提供了多维度的数据模型和灵活的查询接口。Prometheus既支持通过静态文件配置监控对象,还支持自动发现机制,能通过Kubernetes、Consl、DNS等多种方式动态获取监控对象。在数据采集方面,借助GO语言高并发的特性,一个Prometheus设备可以采集数百个节点的监控数据;在数据存储方面,单机Prometheus支持每秒10^6个指标采集,并且还支持大量存储场景下的远程存储。
二、安装prometheus
1、下载二进制对应系统的安装包安装
到prometheus官网下载对应系统对应版本的安装包并上传至服务器,如图所示
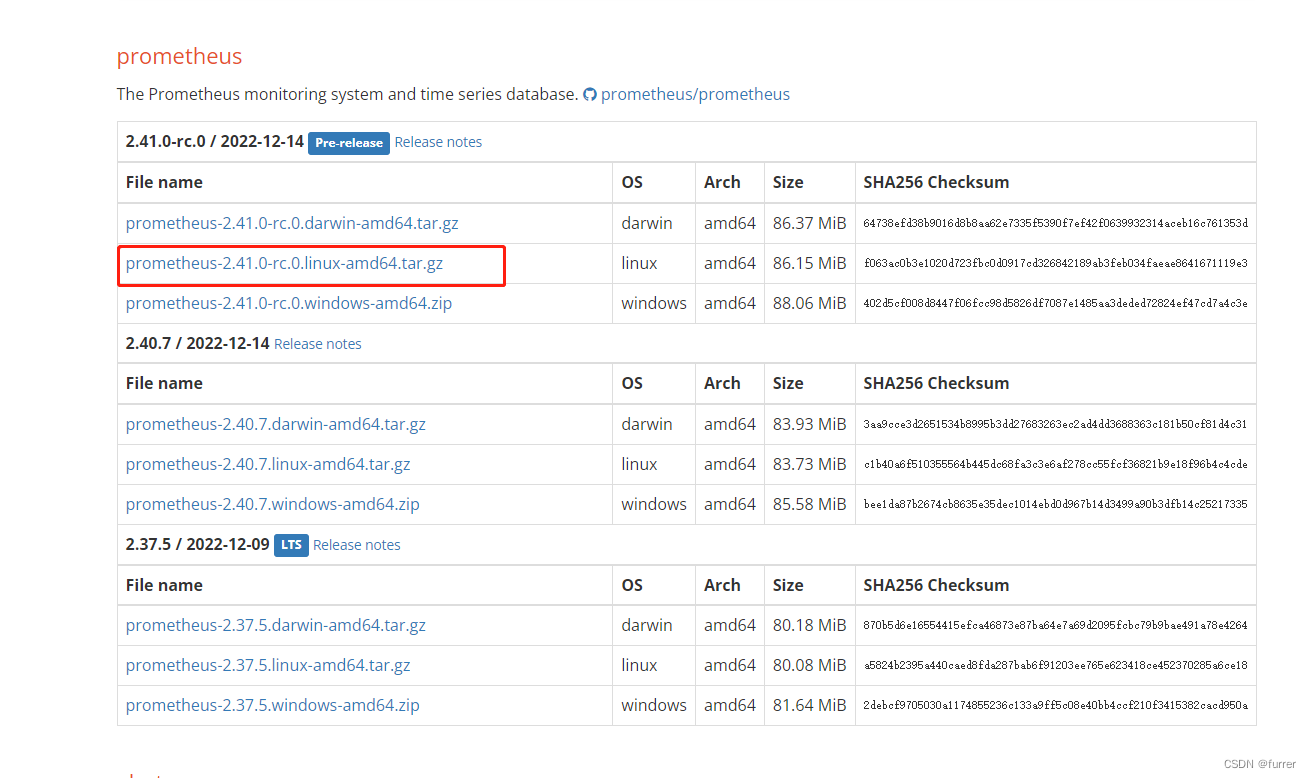
2、解压缩并改名
tar -zxvf prometheus-2.41.0.linux-amd64.tar.gz -C /home/server/
mv prometheus-2.41.0.linux-amd64 prometheus
cd promethues
3、配置监控的信息
这里以kafka监控为例
第一步 配置监控信息
vim prometheus.yml
# my global config
global:
  scrape_interval: 15s # Set the scrape interval to every 15 seconds. Default is every 1 minute.
  evaluation_interval: 15s # Evaluate rules every 15 seconds. The default is every 1 minute.
  # scrape_timeout is set to the global default (10s).

# Alertmanager configuration
alerting:
  alertmanagers:
    - static_configs:
        - targets:
          # - alertmanager:9093

# Load rules once and periodically evaluate them according to the global 'evaluation_interval'.
rule_files:
  # - "first_rules.yml"
  # - "second_rules.yml"

# A scrape configuration containing exactly one endpoint to scrape:
# Here it's Prometheus itself.
scrape_configs:
  # The job name is added as a label `job=<job_name>` to any timeseries scraped from this config.
  - job_name: "prometheus"

    # metrics_path defaults to '/metrics'
    # scheme defaults to 'http'.

   #kafka集群监控
   - job_name: 'kafka'
     static_configs:
      - targets: ['172.17.9.191:9308']
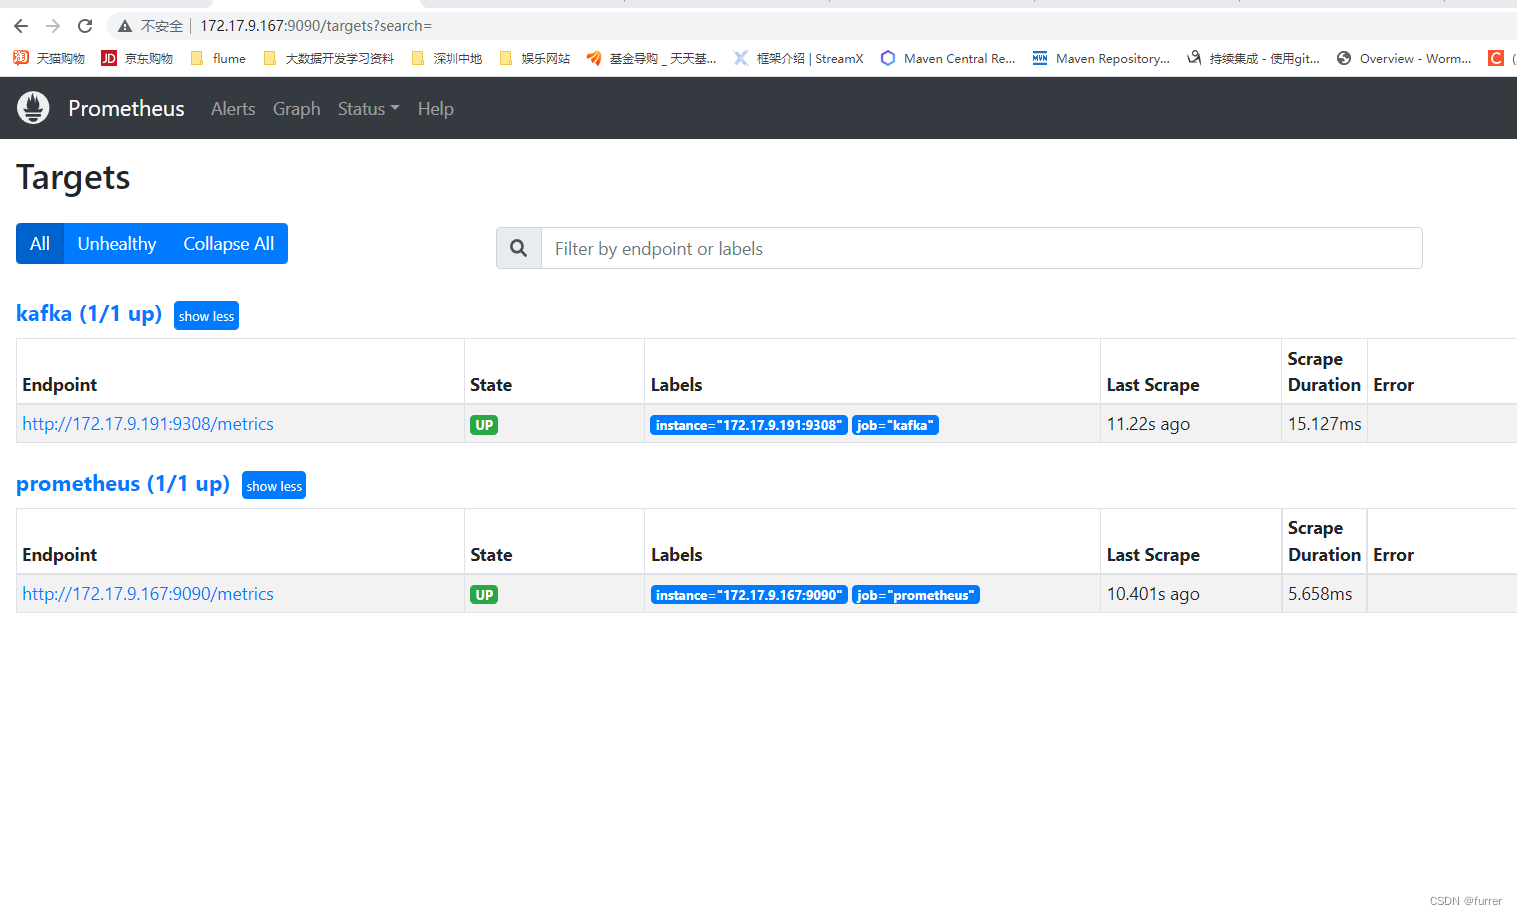
第二步 启动prometheus服务
/home/server/prometheus/prometheus --config.file="/home/server/prometheus/prometheus.yml" &
在浏览器输入ip:9090,如图所示
第三步 配置启停服务
#编辑prometheus.service服务
vim /lib/systemd/system/prometheus.service

[Unit]
Description=https://prometheus.io
[Service]
Restart=on-failure
ExecStart=/home/server/prometheus/prometheus --storage.tsdb.path=/home/server/prometheus/data --config.file=/home/server/prometheus/prometheus.yml --storage.tsdb.retention.time=50d
[Install]
WantedBy=multi-user.target

#重载系统服务配置
systemctl daemon-reload
#杀掉原先启动的prometheus进程
ps -ef | grep prometheus | grep -v grep | awk '{print $2}' | xargs -I '{}' kill -9 {}
#用服务启动prometheus,停止使用stop
systemctl start prometheus.service
#查看prometheus服务状态
systemctl status prometheus.service
● prometheus.service - https://prometheus.io
   Loaded: loaded (/usr/lib/systemd/system/prometheus.service; disabled; vendor preset: disabled)
   Active: active (running) since 二 2022-12-20 17:17:43 CST; 7s ago
 Main PID: 15502 (prometheus)
    Tasks: 6
   CGroup: /system.slice/prometheus.service
           └─15502 /home/server/prometheus/prometheus --storage.tsdb.path=/home/server/prometheus/data --config.file=/home/server/prometheus/prometheus.yml --storage.t...

12月 20 17:17:43 node04 prometheus[15502]: ts=2022-12-20T09:17:43.154Z caller=head.go:615 level=info component=tsdb msg="WAL segment loaded" segment=3 maxSegment=5
12月 20 17:17:43 node04 prometheus[15502]: ts=2022-12-20T09:17:43.185Z caller=head.go:615 level=info component=tsdb msg="WAL segment loaded" segment=4 maxSegment=5
12月 20 17:17:43 node04 prometheus[15502]: ts=2022-12-20T09:17:43.185Z caller=head.go:615 level=info component=tsdb msg="WAL segment loaded" segment=5 maxSegment=5
12月 20 17:17:43 node04 prometheus[15502]: ts=2022-12-20T09:17:43.185Z caller=head.go:621 level=info component=tsdb msg="WAL replay completed" checkpoint_re…=38.400998ms
12月 20 17:17:43 node04 prometheus[15502]: ts=2022-12-20T09:17:43.188Z caller=main.go:997 level=info fs_type=XFS_SUPER_MAGIC
12月 20 17:17:43 node04 prometheus[15502]: ts=2022-12-20T09:17:43.188Z caller=main.go:1000 level=info msg="TSDB started"
12月 20 17:17:43 node04 prometheus[15502]: ts=2022-12-20T09:17:43.188Z caller=main.go:1181 level=info msg="Loading configuration file" filename=/home/server...etheus.yml
12月 20 17:17:43 node04 prometheus[15502]: ts=2022-12-20T09:17:43.189Z caller=main.go:1218 level=info msg="Completed loading of configuration file" filename=/home/ser…µs
12月 20 17:17:43 node04 prometheus[15502]: ts=2022-12-20T09:17:43.189Z caller=main.go:961 level=info msg="Server is ready to receive web requests."
12月 20 17:17:43 node04 prometheus[15502]: ts=2022-12-20T09:17:43.190Z caller=manager.go:941 level=info component="rule manager" msg="Starting rule manager..."
Hint: Some lines were ellipsized, use -l to show in full.
三、安装配置grafana面板
1、下载二进制对应系统的安装包安装
根据所用系统去选择下载命令:grafana官网下载
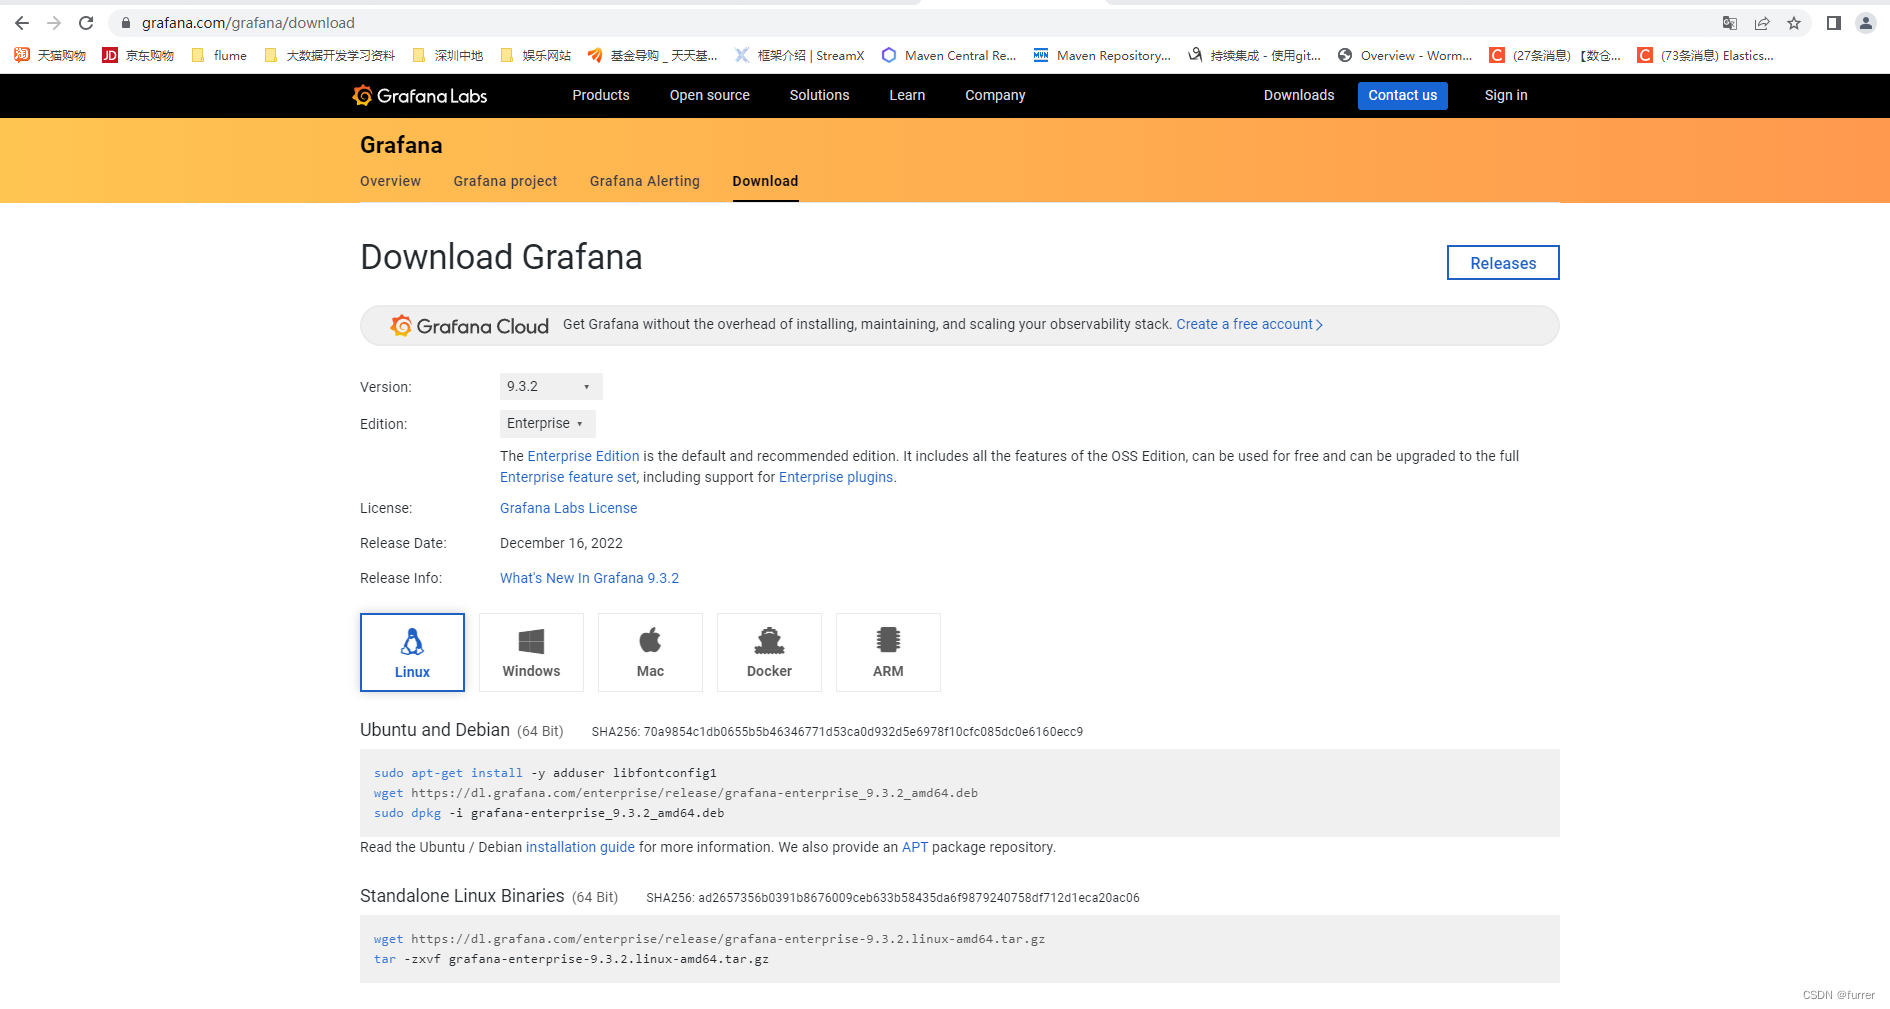
下载好后上传至服务器
2、解压缩并改名
tar -zxvf grafana-enterprise-9.3.2.linux-amd64.tar.gz -C /home/server
mv grafana-enterprise-9.3.2.linux-amd64 grafana
#或者用yum安装
wget https://dl.grafana.com/enterprise/release/grafana-enterprise-9.3.2-1.x86_64.rpm
sudo yum install grafana-enterprise-9.3.2-1.x86_64.rpm
##添加到系统服务并启动
/sbin/chkconfig --add grafana_server
service grafana_server start
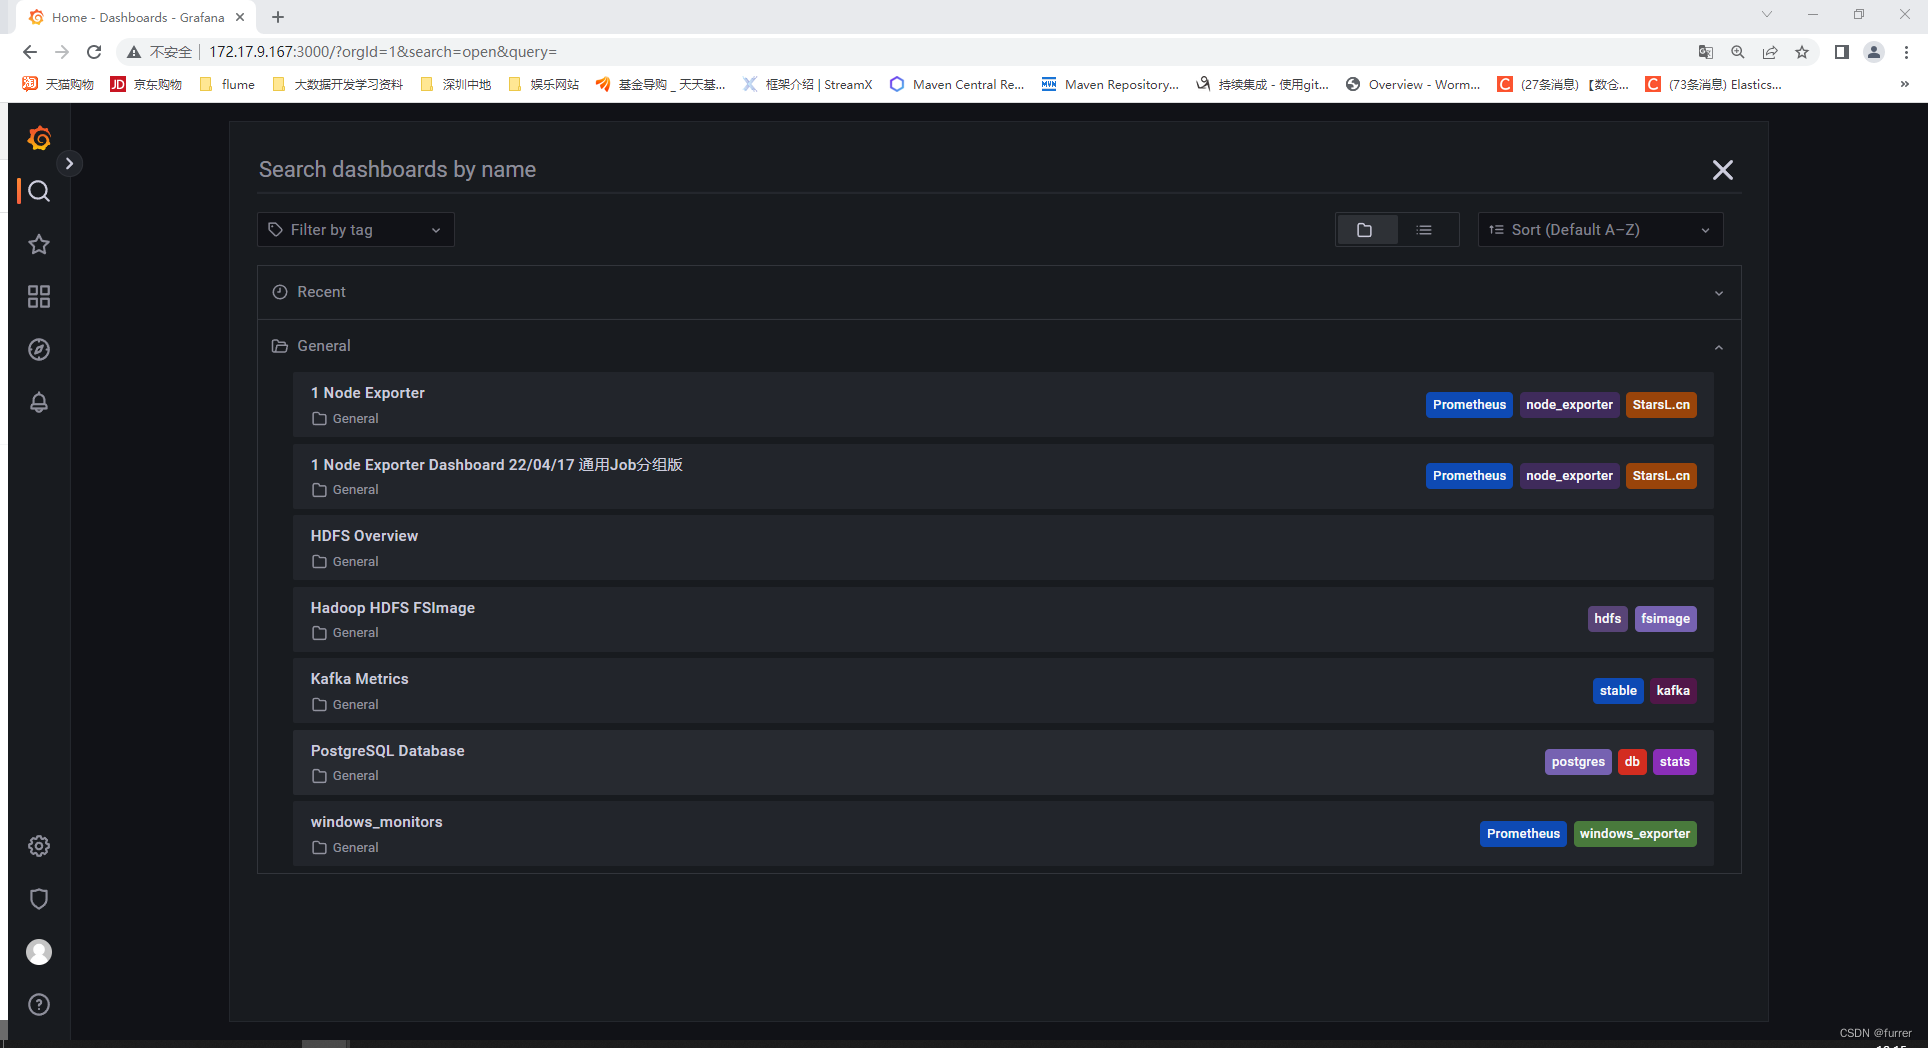
##访问地址:http://IP:3000
默认账户密码:admin/admin
grafana看板模板网站:grafana模板网站


 2037
2037


 被折叠的 条评论
为什么被折叠?
被折叠的 条评论
为什么被折叠?
 到【灌水乐园】发言


