


前言
记录在 vue 中实现echarts 实现三角锥形柱形图效果
本文使用 echarts 为 5.x 版本
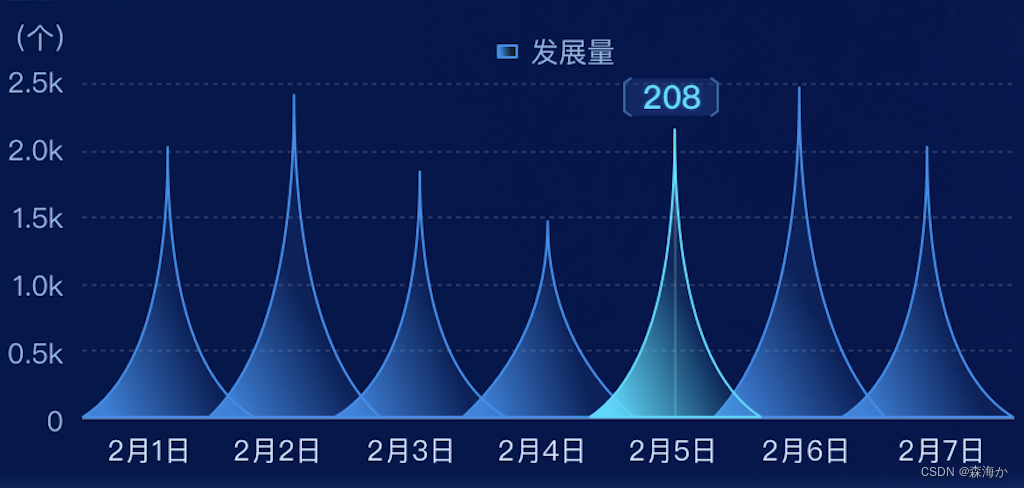
一、效果展示
三角锥形柱形图实现效果
二、echarts图表配置
dom 中使用、初始化
echarts 下载、使用 点击此处查看
废话不多说,直接上option配置
let option = {
      grid: {
        top: 30,
        bottom: 20
      },
      xAxis: [
        {
          data: [
            "2月1日",
            "2月2日",
            "2月3日",
            "2月4日",
            "2月5日",
            "2月6日",
            "2月7日"
          ],
          axisLabel: {
            color: "#fff",
            fontSize: 10
          },
          axisTick: {
            show: false
          },
          axisLine: {
            show: false
          }
        }
      ],
      yAxis: [
        {
          name: "(个)",
          nameTextStyle: {
            color: "#8CB5E2"
          },
          splitLine: {
            show: true,
            lineStyle: {
              type: "dashed",
              color: "#182450"
            }
          },
          axisLabel: {
            color: "#8CB5E2"
          }
        }
      ],
      // 使用内部缩放(滚轮缩放、鼠标拖着左右滑动)
      dataZoom: [
        {
          type: "inside",
          minValueSpan: 6, // 最小展示数
		  start: 0, // 开始展示位置(默认)
		  end: 5 // 结束展示位置 (默认)
        }
      ],
      series: [
        {
          name: "hill",
          // 象柱形图
          type: "pictorialBar",
          // 同一系列的柱间距离
          barCategoryGap: "-60%",
          // 自定义svg 图标 (三角锥形的关键)
          symbol: "path://M0,10 L10,10 C5.5,10 5.5,5 5,0 C4.5,5 4.5,10 0,10 z",
          // 默认样式
          itemStyle: {
            label: {
              show: false
            },
            borderColor: "#206fde",
            borderWidth: 2,
            color: {
              colorStops: [
                {
                  offset: 0,
                  color: "rgba(0,238,255, 0.09)"
                },
                {
                  offset: 1,
                  color: "rgba(29,111,218, 0.5)"
                }
              ]
            }
          },
          // 鼠标滑过样式
          emphasis: {
            label: {
              show: true,
              position: "top",
              color: "#12DCFF"
            },
            itemStyle: {
              borderColor: "#17cdfa",
              borderWidth: 2,
              color: {
                colorStops: [
                  {
                    offset: 0,
                    color: "rgba(0,238,255, 0.09)"
                  },
                  {
                    offset: 1,
                    color: "rgba(23,205,250, 0.5)"
                  }
                ]
              }
            }
          },
          data: [
            15,
            18,
            12,
            23,
            56,
            78,
            34
          ],
          z: 10
        }
      ]
    }
总结
以上就是今天要讲的内容,本文仅仅简单介绍了实现三角锥形柱形图的使用,如果想使用更炫酷的效果请查看 官网API文档


 4023
4023

 被折叠的 条评论
为什么被折叠?
被折叠的 条评论
为什么被折叠?
 到【灌水乐园】发言


