


前言
记录在 vue 中实现echarts 实现圆柱体柱形图效果
本文使用 echarts 为 5.x 版本
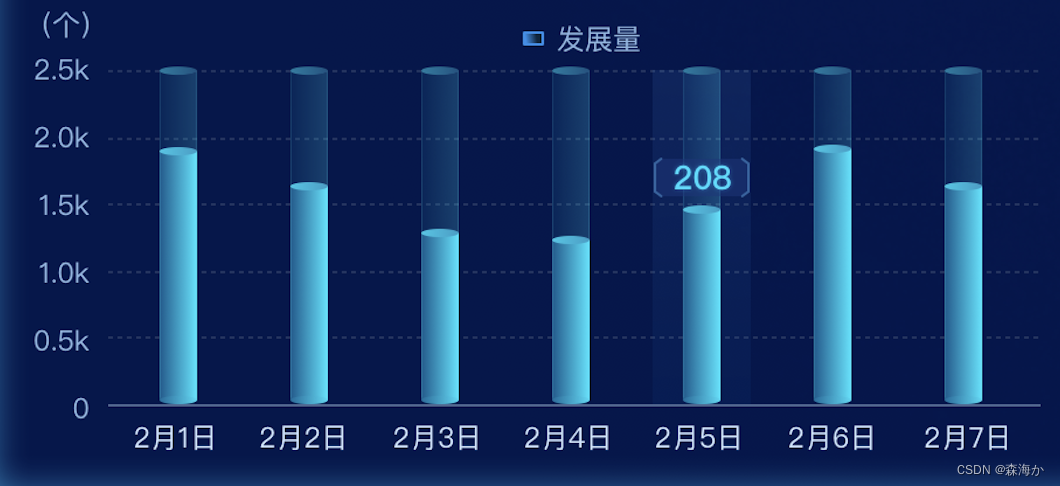
一、效果展示
圆柱体柱形图实现效果
二、echarts图表配置
dom 中使用、初始化
echarts 下载、使用 点击此处查看
实现思路
let option = {
      grid: {
        top: 30,
        right: 0,
        bottom: 20
      },
      xAxis: [
        {
          data: ["2月1日", "2月2日", "2月3日", "2月4日", "2月5日", "2月6日", "2月7日"],
          axisTick: {
            show: false
          },
          axisLine: {
            show: false
          },
          axisLabel: {
            show: true,
            fontSize: 10,
            color: "#fff"
          }
        }
      ],
      yAxis: [
        {
          type: "value",
          name: "(个)",
          nameTextStyle: {
            color: "#8CB5E2"
          },
          splitLine: {
            show: true,
            lineStyle: {
              type: "dashed",
              color: "#182450"
            }
          },
          axisLabel: {
            color: "#8CB5E2"
          }
        }
      ],
      series: [
        {
          // 真实数据
          data: [70, 100, 200, 230, 200, 400, 270],
          name: "顶部圆片 (柱形图顶部)",
          //symbol标记类型包括 'circle', 'rect', 'roundRect', 'triangle', 'diamond','pin','arrow', 'none' (默认为圆形)
          type: 'pictorialBar', //指定类型
          symbolSize: [16, 5], //指定大小,[宽,高]
          symbolOffset: [0, -3], //位置偏移 [右,下] 负数反方向
          z: 12, // 层级(优先级展示)
          itemStyle: {
            color: "rgba(48,228,255,1)"
          },
          symbolPosition: "end"
        },
        {
          name: '真实数据柱形图',
          type: "pictorialBar",
          symbolSize: [16, 5],
          symbolOffset: [0, 2],
          z: 12,
          itemStyle: {
            color: "rgba(48,228,255,1)"
          },
          // 真实数据
          data: [70, 100, 200, 230, 200, 400, 270]
        },
        {
          name: '底部圆片(柱形图底部)',
          type: "bar",
          itemStyle: {},
          z: 16,
          silent: true,
          barWidth: 16,
          barGap: "-100%",
          showBackground: true,
          backgroundStyle: {
            color: "rgba(20,82,130, 0.4)"
          },
          // 真实数据
          data: [70, 100, 200, 230, 200, 400, 270],
        },
        {
          name: "最顶部圆片(背部阴影最顶部圆片)",
          type: "pictorialBar",
          symbolSize: [16, 3],
          symbolOffset: [0, 0],
          z: 3,
          symbolPosition: "end",
          itemStyle: {
            color: "#0D7DA3",
            opacity: 0.7
          },
          // 设置最大数据,可以不设置data,默认为真实数据的最大值
          data: [500, 500, 500, 500, 500, 500, 500]
        }
      ]
    }
总结
以上就是今天要讲的内容,本文仅仅简单介绍了实现圆柱体柱形图的使用,如果想使用更炫酷的效果请查看 官网API文档


 4917
4917


 被折叠的 条评论
为什么被折叠?
被折叠的 条评论
为什么被折叠?
 到【灌水乐园】发言


