


perf 中的 cpu-cycles event 介绍
cycles简介
cycles事件记录处理器核心执行的时钟周期数。每个时钟周期代表处理器内部时钟振荡器的一个周期。这个事件通常用于衡量处理器的执行速度,因为它直接反映了指令执行所需的时间。一个较高的cycles计数可能意味着代码执行较慢,因为需要更多的时钟周期来完成任务。
instructions 和 cycles的关系
instructions事件则记录处理器执行的指令数。这通常用来评估指令级别的效率,因为它显示了程序执行了多少条指令。如果一条指令需要多个时钟周期来执行,那么instructions与cycles之间的比率可以用来估算指令级的效率。一个较低的instructions/cycle比率表示更高的指令级并行性或更有效的代码。
在性能分析中,通常会关注这两个指标的比值,即instructions per cycle (IPC),来评估代码的执行效率。IPC越高,表示每时钟周期执行的指令越多,程序的执行效率也就越高。如果一个程序的IPC下降,可能是因为出现了分支预测错误、内存访问延迟或其他性能瓶颈。
perf cycles 分析
看环境是否支持 cycles 采集
[root@localhost ~]# perf list | grep cycles
...
  cpu-cycles OR cycles                               [Hardware event]
...
查看当前环境cpu频率: 2.6GHz
[root@localhost ~]# cat /sys/devices/system/cpu/cpu0/cpufreq/cpuinfo_cur_freq
2600000
写一个简单的程序,让cpu利用率跑100%:
// test.cpp
int main() {
    while(1);
    return 0;
}
[root@localhost ~]# g++ test.cpp -o test
[root@localhost ~]# ./test
[root@localhost ~]# perf stat -e cycles -p `pidof test` sleep 1

 Performance counter stats for process id '515011':

     2,601,831,429      cycles

       1.000756985 seconds time elapsed
可以看出这个值近似等于2.6G
进一步测试
写一个程序,让控制cpu利用率在20%左右
#include <iostream>
#include <chrono>
#include <unistd.h>

int main() {
    int ratio = 20;
    int base_time = 1000;
    int sleeptime = base_time * (100-ratio);
    int runtime = base_time * ratio;
    while(true) {
        auto start = std::chrono::high_resolution_clock::now();
        while(std::chrono::duration_cast<std::chrono::microseconds>(std::chrono::high_resolution_clock::now() - start).count() < runtime) {}
        usleep(sleeptime);
    }

    return 0;
}
[root@localhost ~]# perf stat -e cycles -p `pidof test` sleep 1
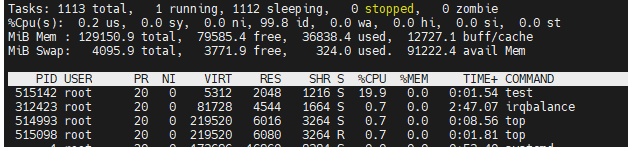
Performance counter stats for process id '515142':
520,289,676 cycles
1.000767149 seconds time elapsed
520,289,676/2,601,831,429=0.199
可以看出,结合cycles 和 系统频率可以换算出cpu利用率,利用perf采集各个线程的cycles,可以计算这个线程的负载。
采用perf record 的 方式
控制采集频率为 50Hz
[root@localhost ~]# perf record -h
    -a, --all-cpus        system-wide collection from all CPUs
    -c, --count <n>       event period to sample
    -e, --event <event>   event selector. use 'perf list' to list available events
    -F, --freq <freq or 'max'>
                          profile at this frequency
[root@localhost ~]# perf record -e cycles -F 1  -p `pidof test`  sleep 50
[ perf record: Woken up 1 times to write data ]
[ perf record: Captured and wrote 0.014 MB perf.data (12 samples) ]
[root@localhost ~]# perf script -i perf.data
            test 515142 4507231.759994:          1 cycles:  ffff50d8eeff379c finish_task_switch+0x74 ([kernel.kallsyms])
            test 515142 4507231.759996:          1 cycles:  ffff50d8eeff379c finish_task_switch+0x74 ([kernel.kallsyms])
            test 515142 4507231.759997:          1 cycles:  ffff50d8eeff379c finish_task_switch+0x74 ([kernel.kallsyms])
            test 515142 4507231.760015:      45456 cycles:      ffff904e03cc __kernel_clock_gettime+0xcc ([vdso])
            test 515142 4507243.582136: 6176126731 cycles:            400a40 std::chrono::operator-<long, std::ratio<1l, 1000000000l>, long, std::ratio<1l, 1000000000l> >+0x58 (/home/test)
            test 515142 4507248.582382: 2593218597 cycles:            4009d4 std::chrono::duration<long, std::ratio<1l, 1000000l> >::count+0x4 (/home/test)
            test 515142 4507253.582381: 2592326656 cycles:            400a28 std::chrono::operator-<long, std::ratio<1l, 1000000000l>, long, std::ratio<1l, 1000000000l> >+0x40 (/home/test)
            test 515142 4507258.581960: 2591492485 cycles:      ffff904e03f4 __kernel_clock_gettime+0xf4 ([vdso])
            test 515142 4507263.581284: 2591325615 cycles:            400a28 std::chrono::operator-<long, std::ratio<1l, 1000000000l>, long, std::ratio<1l, 1000000000l> >+0x40 (/home/test)
            test 515142 4507268.580381: 2590221715 cycles:      ffff904e03e4 __kernel_clock_gettime+0xe4 ([vdso])
            test 515142 4507273.501923: 2596489317 cycles:            400964 std::chrono::time_point<std::chrono::_V2::system_clock, std::chrono::duration<long, std::ratio<1l, 1000000000l> > >::time_since_epoch+0x4 (>
            test 515142 4507278.502390: 2594059695 cycles:      ffff904e040c __kernel_clock_gettime+0x10c ([vdso])
以1Hz的频率采样,可以看出,当perf稳定下来后,cycles稳定在 2.59e6,相邻的数据事件间隔5s,换算过后,也是相当于20%的cpu占用率。但是这似乎与我的预期不符,我的程序1s中实际会在运行状态下多次,理论上每秒都会采到,采样率1Hz,cpu利用率,采样时间50s, 实际的样本个数才有12个,似乎是 样本个数约等于采样间隔 * 采样频率 * 线程cpu利用率。
通过此方法计算线程的利用率,必须考虑时间戳,或者计算的周期要比采样周期大很多,如果采样1s,每1s计算下占用率,那么就会出现每5s的计算的线程占用率100%,其余是0%;
将程序绑在 core 10 上运行,观察现象。现象基本一致。
[root@localhost ~]# perf record -e cycles -F 1  -C 10  sleep 50
[ perf record: Woken up 1 times to write data ]
[ perf record: Captured and wrote 0.417 MB perf.data (11 samples) ]
[root@localhost ~]# perf script -i perf.data
            test 515307 [010] 4509711.079092:          1 cycles:            400a10 std::chrono::operator-<long, std::ratio<1l, 1000000000l>, long, std::ratio<1l, 1000000000l> >+0x28 (/home/test)
            test 515307 [010] 4509711.079094:          1 cycles:            400a10 std::chrono::operator-<long, std::ratio<1l, 1000000000l>, long, std::ratio<1l, 1000000000l> >+0x28 (/home/test)
            test 515307 [010] 4509711.079095:          1 cycles:            400a10 std::chrono::operator-<long, std::ratio<1l, 1000000000l>, long, std::ratio<1l, 1000000000l> >+0x28 (/home/test)
            test 515307 [010] 4509711.079121:      67206 cycles:      fffd5d4503f4 __kernel_clock_gettime+0xf4 ([vdso])
            test 515307 [010] 4509726.498642: 8000773091 cycles:      fffd5d4503f4 __kernel_clock_gettime+0xf4 ([vdso])
            test 515307 [010] 4509731.213642: 2447049195 cycles:      fffd5d4503e0 __kernel_clock_gettime+0xe0 ([vdso])
            test 515307 [010] 4509736.170329: 2574579536 cycles:      fffd5d4503e4 __kernel_clock_gettime+0xe4 ([vdso])
            test 515307 [010] 4509741.066237: 2540232188 cycles:      fffd5d4503f4 __kernel_clock_gettime+0xf4 ([vdso])
            test 515307 [010] 4509746.031759: 2575910682 cycles:      fffd5d2f9ba0 clock_gettime@plt+0x0 (/usr/lib64/libstdc++.so.6.0.24)
            test 515307 [010] 4509750.937614: 2546808087 cycles:      fffd5d45040c __kernel_clock_gettime+0x10c ([vdso])
            test 515307 [010] 4509755.894792: 2574924584 cycles:            400878 main+0x74 (/home/test)
以固定周期数采样
[root@localhost ~]# perf record -e cycles -c 520000000  -p `pidof test` sleep 10
[ perf record: Woken up 1 times to write data ]
[ perf record: Captured and wrote 0.014 MB perf.data (9 samples) ]
[root@localhost ~]# perf script -i perf.data
            test 515307 4510198.258890:  520000000 cycles:            400a94 std::chrono::__duration_cast_impl<std::chrono::duration<long, std::ratio<1l, 1000000l> >, std::ratio<1l, 1000l>, long, true, false>::__cast<long, std::ratio<1l, 1000000000l> >>
            test 515307 4510199.263843:  520000000 cycles:      fffd5d4503e4 __kernel_clock_gettime+0xe4 ([vdso])
            test 515307 4510200.268764:  520000000 cycles:      fffd5d4503f4 __kernel_clock_gettime+0xf4 ([vdso])
            test 515307 4510201.273860:  520000000 cycles:      fffd5d325304 std::chrono::_V2::system_clock::now+0x4c (/usr/lib64/libstdc++.so.6.0.24)
            test 515307 4510202.278955:  520000000 cycles:            400a8c std::chrono::__duration_cast_impl<std::chrono::duration<long, std::ratio<1l, 1000000l> >, std::ratio<1l, 1000l>, long, true, false>::__cast<long, std::ratio<1l, 1000000000l> >>
            test 515307 4510203.275996:  520000000 cycles:      fffd5d4503f4 __kernel_clock_gettime+0xf4 ([vdso])
            test 515307 4510204.281150:  520000000 cycles:      fffd5d4503f4 __kernel_clock_gettime+0xf4 ([vdso])
            test 515307 4510205.286123:  520000000 cycles:      fffd5d4503f4 __kernel_clock_gettime+0xf4 ([vdso])
            test 515307 4510206.291034:  520000000 cycles:            400ab0 std::chrono::duration<long, std::ratio<1l, 1000000l> >::duration<long, void>+0x14 (/home/test)
这样每秒都可以采到。


 2735
2735


 被折叠的 条评论
为什么被折叠?
被折叠的 条评论
为什么被折叠?
 到【灌水乐园】发言


