


Prometheus官网:https://prometheus.io/docs/introduction/first_steps/
Grafana官网:https://grafana.com/docs/grafana/latest/
SpringBoot+Prometheus+Grafana是目前比较常用的应用监控方案,由Springboot项目暴露指标,Prometheus进行信息采集,Grafana实现可视化监控与报警。
一、Prometheus安装与使用
安装包下载地址:https://prometheus.io/download/
下载lunix版本

通过WinSCP将文件拷贝到lunix服务器上,然后用命令解压和启动
# 解压
tar xf prometheus-2.35.0-rc0.linux-amd64.tar.gz
# 重命名
mv /root/prometheus-2.35.0-rc0.linux-amd64 /root/prometheus-2.35.0
# 进入目录
cd /root/prometheus-2.35.0
# 启动,&符号为连接符,代表后台运行,不占用终端窗口
./prometheus --config.file="/root/prometheus-2.35.0/prometheus.yml" &
# 若想指定启动端口 则加上--web.listen-address=:9999,热加载配置也可加上:--web.enable-lifecycle
 ./prometheus --web.enable-lifecycle --config.file="/root/prometheus-2.35.0/prometheus.yml"  --web.listen-address=:9999 &
本服务器的ip为192.168.32.124,prometheus默认端口为9090,本文由于端口冲突,更改端口为9999,对应的得更改prometheus.yml文件,修改后得重新启动prometheus

热启动配置
curl -XPOST http://localhost:9999/-/reload
关闭prometheus
# 查看端口号
ps -ef |grep prometheus
# 杀掉进程
kill -TERM 对应进程号
这样启动和关闭prometheus太麻烦,可以设置自启动
自启动配置
# 编辑文件
vim /usr/lib/systemd/system/prometheus.service
# 文件内容如下 其中:ExecStart=自己本地路径/prometheus --config.file=/自己本地路径/prometheus.yml
[Unit]
Description=Prometheus
After=network.target

[Service]
Type=simple
ExecStart=/root/prometheus-2.35.0/prometheus --web.enable-lifecycle --config.file=/root/prometheus-2.35.0/prometheus.yml --web.listen-address=:9999

[Install]
WantedBy=multi-user.target

# 重新载入配置文件
systemctl daemon-reload
# 设置为开机自启
systemctl enable prometheus.service
# 其他常用命令
# 启动 prometheus 服务
systemctl start prometheus.service
# 关闭 prometheus 服务
systemctl stop prometheus.service
# 重启 prometheus 服务
systemctl restart prometheus.service
启动后使用内网widows服务器的浏览器,查看http://192168.32.124:9999 status > targets
这个为prometheus采集自身的指标

二、Springboot使用Prometheus
1.Springboot项目添加prometheus的Maven依赖
        <dependency>
            <groupId>io.micrometer</groupId>
            <artifactId>micrometer-registry-prometheus</artifactId>
            <version>1.6.4</version>
        </dependency>
2.Springboot项目 yml 配置文件设置
spring:
  application:
    name: cloud-reservoirs

management:
  endpoints:
    web:
      exposure:
        include: "*" # 指定所有的web接口都会上报
  metrics:
    tags:
      application: ${spring.application.name} # 这个应用所有上报的metrics 都会带上 application这个标签
3.编辑 Prometheus 的 prometheus.yml 文件
进入Prometheus的解压目录编辑prometheus.yml文件,添加如下配置
  - job_name: 'cloud-reservoirs'
    scrape_interval: 5s # 抓取频率
    metrics_path: '/actuator/prometheus' # 抓取的端点
    static_configs:
      - targets: ['192.168.32.124:10024'] # 目标机器

接着将项目打包发布到192.168.32.124服务器上,重新启动premetheus
然后使用内网widows服务器的浏览器,查看http://192168.32.124:9999 status > targets

访问 http://192.168.32.124:10024/actuator/prometheus 可以查看各项指标

注:若想采集其他服务器上的项目指标,需要安装使用Node Exporter进行采集,这里不做详细介绍 / 参考博客
访问Graph,在搜索框输入:
http_server_requests_seconds_count,然后点击Execute,可以看到抓起metric的记录
 接着访问我们项目的任一接口,再次查看Graph,可以看到新增了一条记录

三、Grafana安装与使用
1.Grafana安装
安装包下载地址:https://grafana.com/grafana/download?platform=linux
官网上有安装命令,请对应lunix版本去选择,本文为CentOS
wget https://dl.grafana.com/enterprise/release/grafana-enterprise-8.5.0-1.x86_64.rpm
sudo yum install grafana-enterprise-8.5.0-1.x86_64.rpm
启动 granafa
# 重新载入配置文件
systemctl daemon-reload
# 设置为开机自启
systemctl enable grafana-server.service
# 启动 granafa 服务
systemctl start grafana-server.service
# 关闭 granafa 服务
systemctl stop grafana-server.service
# 重启 granafa 服务
systemctl restart grafana-server.service
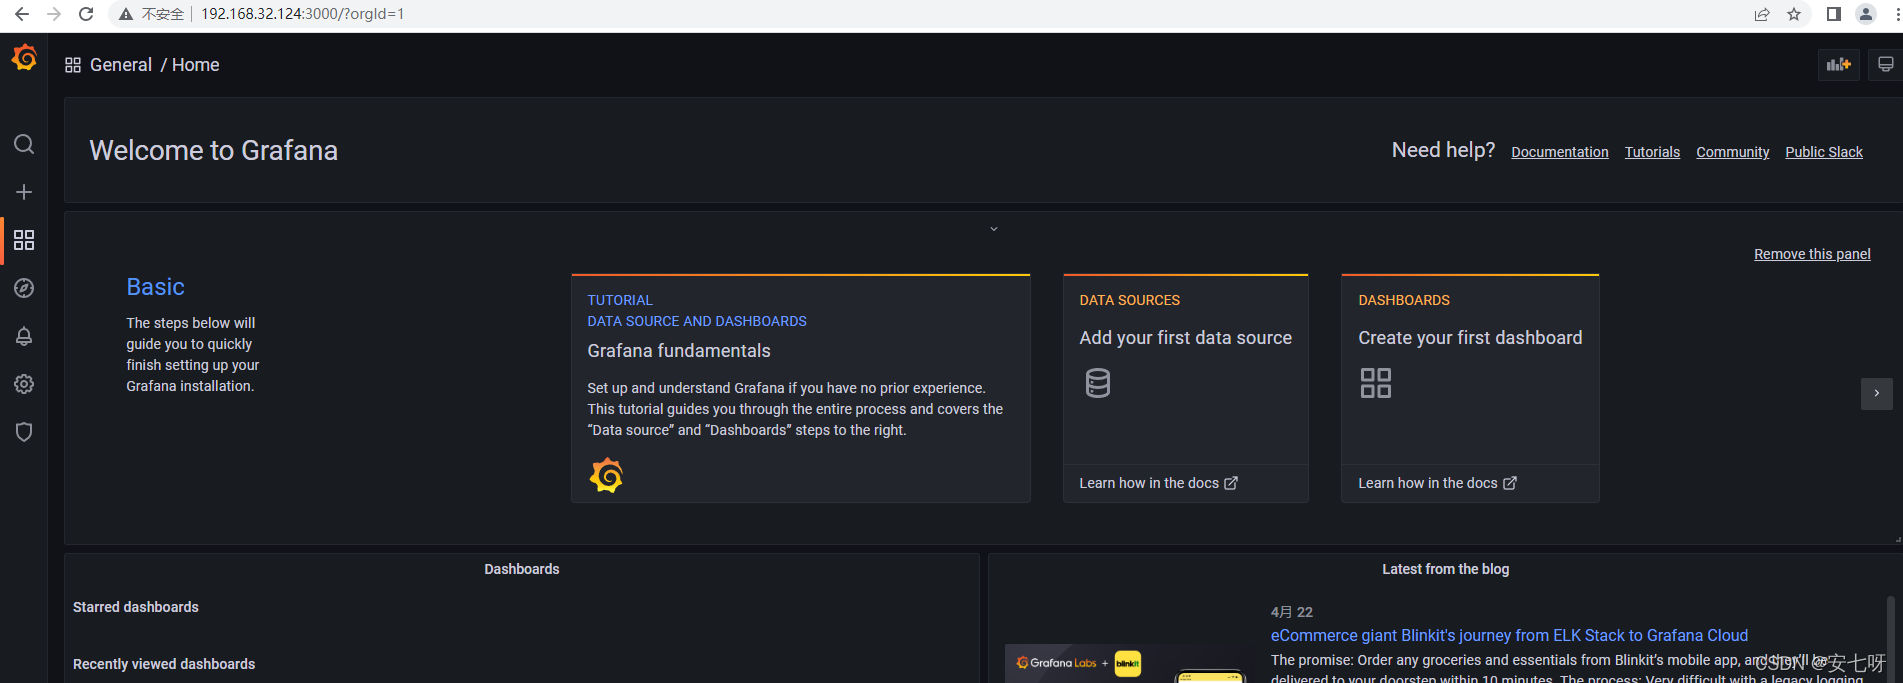
granafa 默认端口为3000,可以在浏览器中输入http://localhost:3000/
granafa 首次登录账户名和密码admin/admin,可以修改,登录后界面如下
2.Grafana使用
(1)grafana启动之后,配置数据源Promethues
点击首界面的 DATA SOURCES

接着选择 Prometheus

然后输入 Prometheus 服务器地址,点击Save & test

(2)给SpringBoot应用配置面板
可以直接使用现成的模板,比如 12856,这需要到官网去查找:
https://grafana.com/grafana/dashboards?dataSource=prometheus&search=spring
选择一个,点进去之后,右边的 Copy ID toClipboard 对应的数字就是我们需要的


拿到ID后,回到Grafana界面,找到如下Import项

输入ID,点击输入框右边的 Load

选择我们前边配置的数据源,点击 Import

配置后面板如下

over ~


 1948
1948


 被折叠的 条评论
为什么被折叠?
被折叠的 条评论
为什么被折叠?
 到【灌水乐园】发言


