


数据获取
wget https://www.cs.toronto.edu/~kriz/cifar-10-python.tar.gz
有关Cifar10数据的更多详细信息参见此篇博客,里面包含了详细的数据读取代码段以及数据文件介绍,为了方便起见,我们采用Paddle自带的datasets模块获取数据集
| airplane |  |  |  |  |  |  |  |  |  |  |
| automobile |  |  |  |  |  |  |  |  |  |  |
| bird |  |  |  |  |  |  |  |  |  |  |
| cat |  |  |  |  |  |  |  |  |  |  |
| deer |  |  |  |  |  |  |  |  |  |  |
| dog |  |  |  |  |  |  |  |  |  |  |
| frog |  |  |  |  |  |  |  |  |  |  |
| horse |  |  |  |  |  |  |  |  |  |  |
| ship |  |  |  |  |  |  |  |  |  |  |
| truck |  |  |  |  |  |  |  |  |  |  |
导入必要的包
import paddle
import math
import numpy as np
import matplotlib.pyplot as plt
import paddle.nn as nn
from paddle.vision.datasets import Cifar10
from paddle.vision.transforms import Normalize
import warnings
from paddle.io import Dataset
warnings.filterwarnings("ignore")
数据处理
定义字典,将数字标签与其名称对应起来
label_dict = {0:"airplane", 1:"automobile", 2:"bird", 3:"cat", 4:"deer",
              5:"dog", 6:"frog", 7:"horse", 8:"ship", 9:"truck"}
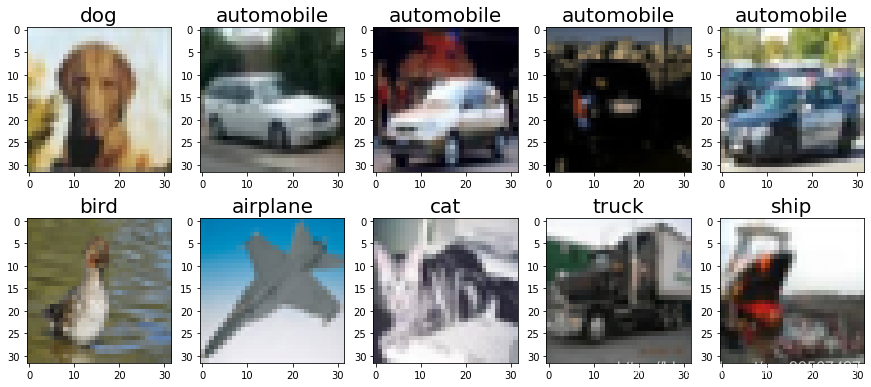
定义绘图函数,将图像数据可视化
def plot_num_images(num):
    if num < 1:
        print('INFO:The number of input pictures must be greater than zero!')
    else:
        choose_list = []
        for i in range(num):
            choose_n = np.random.randint(len(cifar10))
            choose_list.append(choose_n)
        fig = plt.gcf()
        fig.set_size_inches(15, 17)
        for i in range(num):
            ax_img = plt.subplot(math.ceil(num / 2), 5, i + 1)
            plt_img = cifar10[choose_list[i]][0]
            ax_img.imshow(plt_img, cmap='binary')
            ax_img.set_title(label_dict[cifar10[choose_list[i]][1].item()],
                             fontsize=20)
        plt.show()
cifar10 = Cifar10(mode='train', transform=None)

plot_num_images(10)
数据预处理,利用自定义的均值和方差将图像归一化
normalize = Normalize(mean=[127.5, 127.5, 127.5],
                      std=[127.5, 127.5, 127.5],
                      data_format='HWC')
cifar10_train = Cifar10(mode='train', transform=normalize)
cifar10_val = Cifar10(mode='test', transform=normalize)
定义数据类
class Cifar10Dataset(Dataset):
    def __init__(self, mode='train'):
        super(Cifar10Dataset, self).__init__()
        if mode == 'train':
            self.data = [[cifar10_train[i][0].transpose(2, 0, 1).astype('float32'), cifar10_train[i][1].astype('int64')] for i in range(len(cifar10_train))]
        else:
            self.data = [[cifar10_val[i][0].transpose(2, 0, 1).astype('float32'), cifar10_val[i][1].astype('int64')] for i in range(len(cifar10_val))]

    def __getitem__(self, index):
        data = self.data[index][0]
        label = self.data[index][1]

        return data, label

    def __len__(self):
        return len(self.data)
train_loader = paddle.io.DataLoader(Cifar10Dataset(mode='train'), batch_size=1000, shuffle=True)
val_loader = paddle.io.DataLoader(Cifar10Dataset(mode='val'), batch_size=1000, shuffle=True)
建模训练
classification = paddle.nn.Sequential(
    paddle.nn.Conv2D(in_channels=3,
                     out_channels=32,
                     kernel_size=(3, 3),
                     padding=1,
                     padding_mode='zeros'),
    paddle.nn.ReLU(),
    paddle.nn.Dropout(0.2),
    paddle.nn.MaxPool2D(2),
    paddle.nn.Conv2D(in_channels=32,
                     out_channels=64,
                     kernel_size=(3, 3),
                     padding=1,
                     padding_mode='zeros'),
    paddle.nn.ReLU(),
    paddle.nn.Dropout(0.2),
    paddle.nn.MaxPool2D(2),
    paddle.nn.Flatten(),
    paddle.nn.Linear(in_features=4096, out_features=64),
    paddle.nn.Linear(in_features=64, out_features=10),
)

model = paddle.Model(classification)
模型摘要
model.summary((1, 3, 32, 32))
---------------------------------------------------------------------------
 Layer (type)       Input Shape          Output Shape         Param #
===========================================================================
   Conv2D-1       [[1, 3, 32, 32]]     [1, 32, 32, 32]          896
    ReLU-1       [[1, 32, 32, 32]]     [1, 32, 32, 32]           0
   Dropout-1     [[1, 32, 32, 32]]     [1, 32, 32, 32]           0
  MaxPool2D-1    [[1, 32, 32, 32]]     [1, 32, 16, 16]           0
   Conv2D-2      [[1, 32, 16, 16]]     [1, 64, 16, 16]        18,496
    ReLU-2       [[1, 64, 16, 16]]     [1, 64, 16, 16]           0
   Dropout-2     [[1, 64, 16, 16]]     [1, 64, 16, 16]           0
  MaxPool2D-2    [[1, 64, 16, 16]]      [1, 64, 8, 8]            0
   Flatten-1      [[1, 64, 8, 8]]         [1, 4096]              0
   Linear-1         [[1, 4096]]            [1, 64]            262,208
   Linear-2          [[1, 64]]             [1, 10]              650
===========================================================================
Total params: 282,250
Trainable params: 282,250
Non-trainable params: 0
---------------------------------------------------------------------------
Input size (MB): 0.01
Forward/backward pass size (MB): 1.25
Params size (MB): 1.08
Estimated Total Size (MB): 2.34
---------------------------------------------------------------------------


{'total_params': 282250, 'trainable_params': 282250}
model.prepare(optimizer=paddle.optimizer.Adam(learning_rate=0.001, parameters=model.parameters()),
loss=paddle.nn.CrossEntropyLoss(),
metrics=paddle.metric.Accuracy())
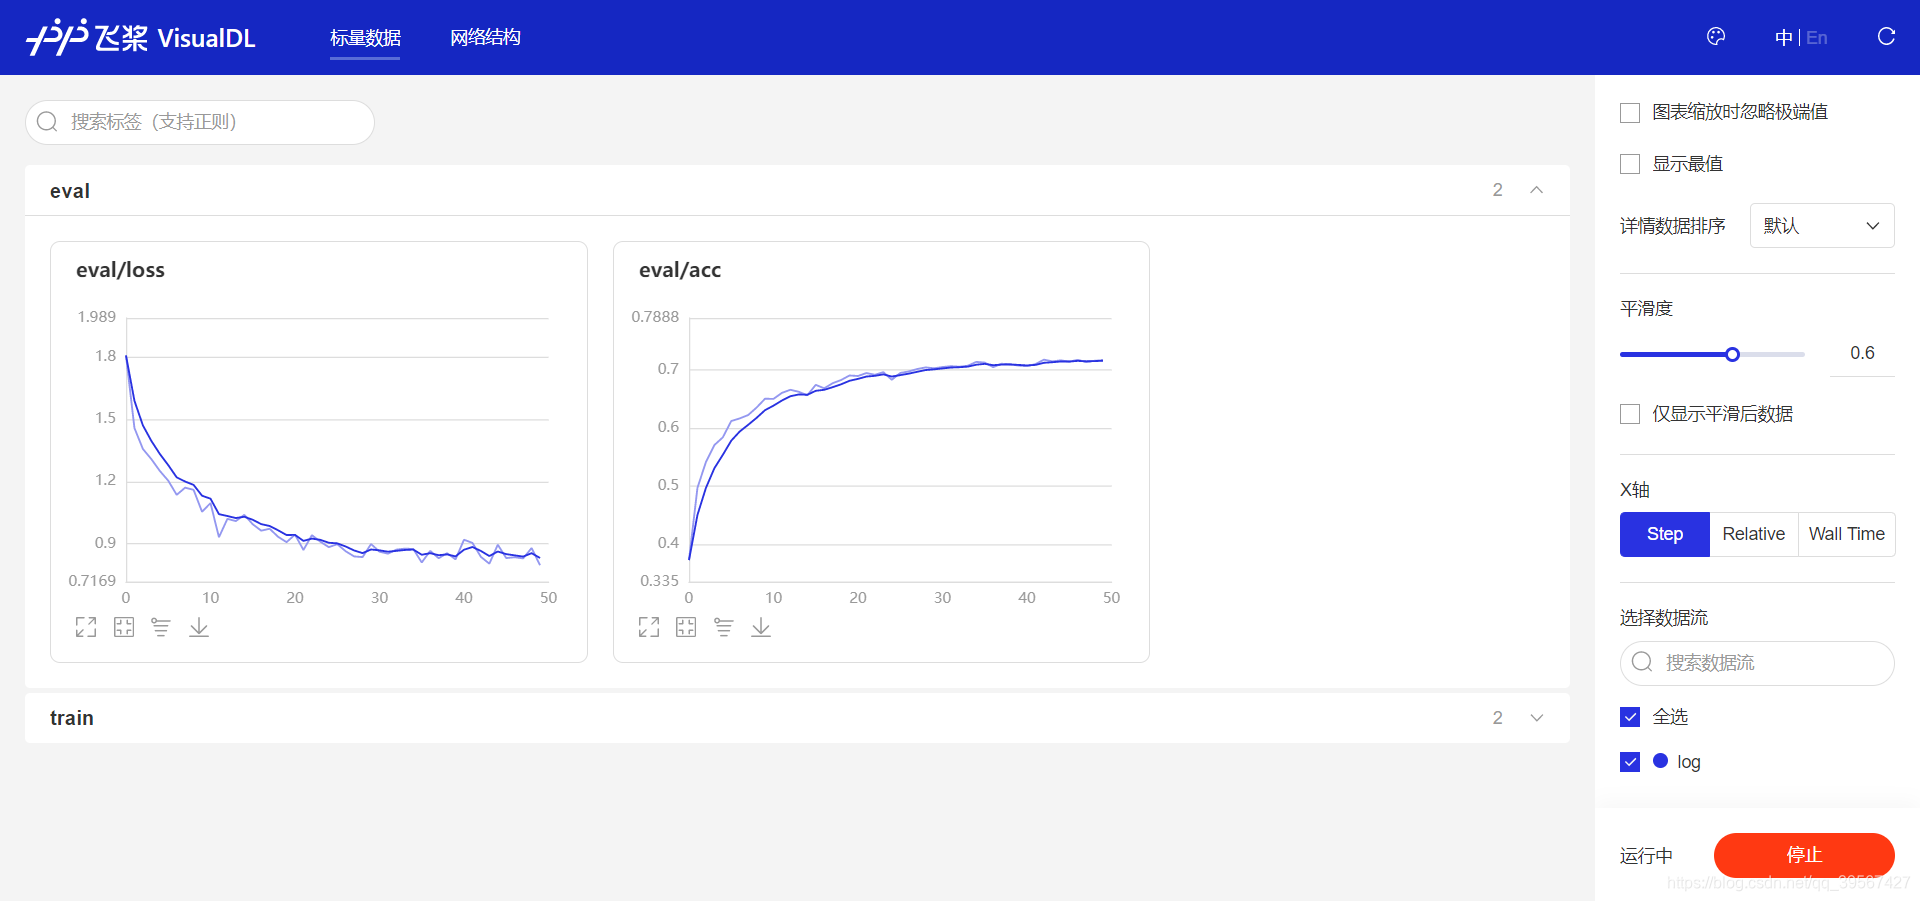
callback = paddle.callbacks.VisualDL(log_dir='log')
model.fit(train_loader,
          val_loader,
          epochs=50,
          batch_size=32,
          verbose=1,
          callbacks=callback)
The loss value printed in the log is the current step, and the metric is the average value of previous step.
Epoch 1/50
step 50/50 [==============================] - loss: 2.0034 - acc: 0.1965 - 160ms/step
Eval begin...
The loss value printed in the log is the current batch, and the metric is the average value of previous step.
step 10/10 [==============================] - loss: 2.0090 - acc: 0.3082 - 59ms/step
Eval samples: 10000
Epoch 2/50
step 50/50 [==============================] - loss: 1.5134 - acc: 0.3903 - 152ms/step
Eval begin...
The loss value printed in the log is the current batch, and the metric is the average value of previous step.
step 10/10 [==============================] - loss: 1.5198 - acc: 0.4750 - 60ms/step
Eval samples: 10000
Epoch 3/50
step 50/50 [==============================] - loss: 1.3807 - acc: 0.4915 - 151ms/step
Eval begin...
The loss value printed in the log is the current batch, and the metric is the average value of previous step.
step 10/10 [==============================] - loss: 1.3898 - acc: 0.5314 - 60ms/step
Eval samples: 10000
Epoch 4/50
step 50/50 [==============================] - loss: 1.2363 - acc: 0.5350 - 152ms/step
Eval begin...
The loss value printed in the log is the current batch, and the metric is the average value of previous step.
step 10/10 [==============================] - loss: 1.3221 - acc: 0.5538 - 60ms/step
Eval samples: 10000
Epoch 5/50
step 50/50 [==============================] - loss: 1.2591 - acc: 0.5620 - 153ms/step
Eval begin...
The loss value printed in the log is the current batch, and the metric is the average value of previous step.
step 10/10 [==============================] - loss: 1.2512 - acc: 0.5718 - 59ms/step
Eval samples: 10000
...
Epoch 45/50
step 50/50 [==============================] - loss: 0.6554 - acc: 0.7828 - 158ms/step
Eval begin...
The loss value printed in the log is the current batch, and the metric is the average value of previous step.
step 10/10 [==============================] - loss: 0.8406 - acc: 0.7103 - 61ms/step
Eval samples: 10000
Epoch 46/50
step 50/50 [==============================] - loss: 0.6264 - acc: 0.7862 - 155ms/step
Eval begin...
The loss value printed in the log is the current batch, and the metric is the average value of previous step.
step 10/10 [==============================] - loss: 0.8596 - acc: 0.7149 - 60ms/step
Eval samples: 10000
Epoch 47/50
step 50/50 [==============================] - loss: 0.5925 - acc: 0.7906 - 154ms/step
Eval begin...
The loss value printed in the log is the current batch, and the metric is the average value of previous step.
step 10/10 [==============================] - loss: 0.8046 - acc: 0.7147 - 61ms/step
Eval samples: 10000
Epoch 48/50
step 50/50 [==============================] - loss: 0.5864 - acc: 0.7932 - 154ms/step
Eval begin...
The loss value printed in the log is the current batch, and the metric is the average value of previous step.
step 10/10 [==============================] - loss: 0.8284 - acc: 0.7163 - 62ms/step
Eval samples: 10000
Epoch 49/50
step 50/50 [==============================] - loss: 0.6019 - acc: 0.7937 - 154ms/step
Eval begin...
The loss value printed in the log is the current batch, and the metric is the average value of previous step.
step 10/10 [==============================] - loss: 0.8471 - acc: 0.7165 - 61ms/step
Eval samples: 10000
Epoch 50/50
step 50/50 [==============================] - loss: 0.5827 - acc: 0.7946 - 153ms/step
Eval begin...
The loss value printed in the log is the current batch, and the metric is the average value of previous step.
step 10/10 [==============================] - loss: 0.7734 - acc: 0.7176 - 61ms/step
Eval samples: 10000
模型验证
通过高阶API的evaluate进行评估
model.evaluate(Cifar10Dataset(mode='test'), batch_size=64, verbose=1)
Eval begin...
The loss value printed in the log is the current batch, and the metric is the average value of previous step.
step 157/157 [==============================] - loss: 0.8158 - acc: 0.7176 - 8ms/step
Eval samples: 10000

{'loss': [0.8157779], 'acc': 0.7176}
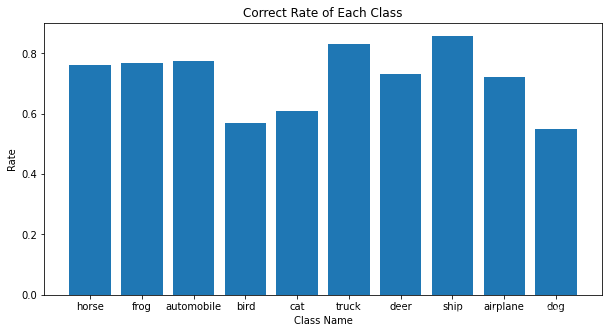
获取每一类的准确率,利用predict对图像进行预测,由于是同一个测试集,可以发现predict准确率与evaluate相同,这也说明代码段的正确性
Correct_num = {0:0, 1:0, 2:0, 3:0, 4:0, 5:0, 6:0, 7:0, 8:0, 9:0}
predict_onehot = model.predict(Cifar10Dataset(mode='test'), batch_size=100)
labels = np.array([cifar10_val[i][1].item() for i in range(len(cifar10_val))])
all_predict_result = []
for i in range(len(predict_onehot[0])):
    predict_result = np.argmax(predict_onehot[0][i], axis=1)
    all_predict_result = np.r_[all_predict_result, predict_result]
print('Acc:', sum(all_predict_result == labels) / len(cifar10_val))
Predict begin...
step 100/100 [==============================] - 11ms/step
Predict samples: 10000
Acc: 0.7176
Correct_num = {0:0, 1:0, 2:0, 3:0, 4:0, 5:0, 6:0, 7:0, 8:0, 9:0}

for i in range(len(labels)):
    if all_predict_result[i] == labels[i]:
        Correct_num[labels[i]] += 1
Correct_rate = {}
for key in Correct_num:
    Correct_rate[label_dict[key]] = Correct_num[key] / sum(labels==key)
Correct_rate
{'airplane': 0.723,
 'automobile': 0.774,
 'bird': 0.57,
 'cat': 0.609,
 'deer': 0.732,
 'dog': 0.549,
 'frog': 0.769,
 'horse': 0.761,
 'ship': 0.858,
 'truck': 0.831}
可视化每一类图像准确率
fig = plt.gcf()
fig.set_size_inches(10, 5)
class_name = {'airplane', 'automobile', 'bird', 'cat', 'deer', 'dog','frog', 'horse', 'ship', 'truck'}
plt.bar(range(10), [Correct_rate.get(class_name, 0) for class_name in class_name], align='center',yerr=0.000001)

plt.xticks(range(10), class_name)
plt.xlabel('Class Name')
plt.ylabel('Rate')
plt.title('Correct Rate of Each Class')
plt.show()
VIsualDL可视化
使用visualdl --logdir log查看训练日志


 137
137


 被折叠的 条评论
为什么被折叠?
被折叠的 条评论
为什么被折叠?
 到【灌水乐园】发言


