


三线表是论文中非常常用的一种表格表示方式
1.引包
\usepackage{booktabs}
\usepackage{threeparttable}
2.插入表格
\renewcommand{\arraystretch}{1} %控制行高
\begin{table}[tp]
\centering
\fontsize{6.5}{8}\selectfont
\begin{threeparttable}
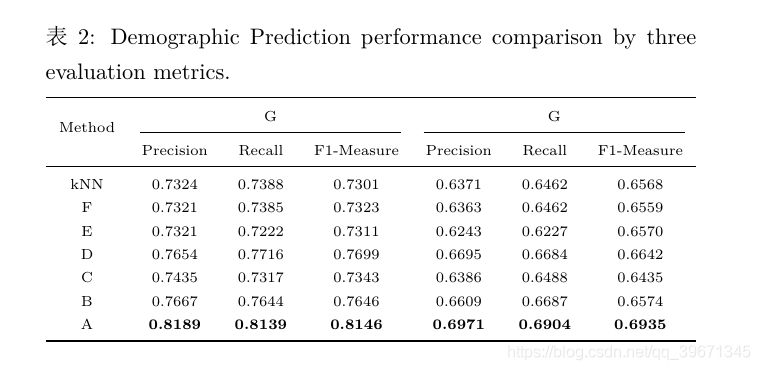
\caption{Demographic Prediction performance comparison by three evaluation metrics.}
\label{tab:performance_comparison}
\begin{tabular}{ccccccc}
\toprule
\multirow{2}{*}{Method}&
\multicolumn{3}{c}{ G}&\multicolumn{3}{c}{ G}\cr
\cmidrule(lr){2-4} \cmidrule(lr){5-7}
&Precision&Recall&F1-Measure&Precision&Recall&F1-Measure\cr
\midrule
kNN&0.7324&0.7388&0.7301&0.6371&0.6462&0.6568\cr
F&0.7321&0.7385&0.7323&0.6363&0.6462&0.6559\cr
E&0.7321&0.7222&0.7311&0.6243&0.6227&0.6570\cr
D&0.7654&0.7716&0.7699&0.6695&0.6684&0.6642\cr
C&0.7435&0.7317&0.7343&0.6386&0.6488&0.6435\cr
B&0.7667&0.7644&0.7646&0.6609&0.6687&0.6574\cr
A&{\bf 0.8189}&{\bf 0.8139}&{\bf 0.8146}&{\bf 0.6971}&{\bf 0.6904}&{\bf 0.6935}\cr
\bottomrule
\end{tabular}
\end{threeparttable}
\end{table}
3.生成
看完记得点赞,(づ ̄3 ̄)づ╭❤~


 562
562

 被折叠的 条评论
为什么被折叠?
被折叠的 条评论
为什么被折叠?
 到【灌水乐园】发言


