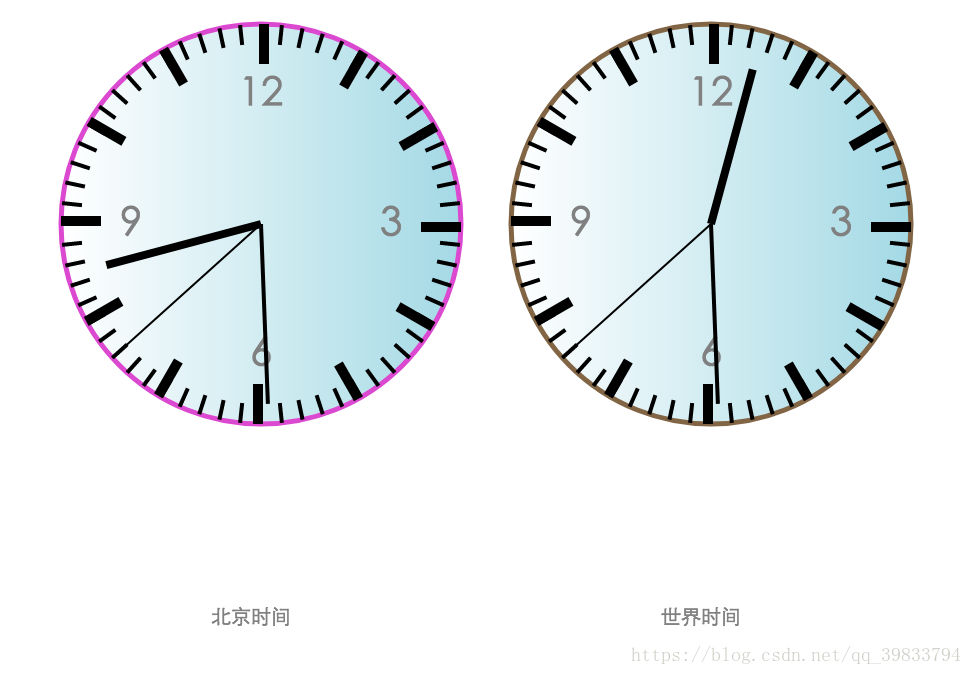
最近在学习canvas,利用面向对象的思想做了一个表的小demo,和大家一起共享一下,有不足之处请多多指点。
小demo中进行了函数的封装,原型函数的使用,canvas动态绘制的方法;
其中利用到了canvas的渐变色方法 — createLineargradient;
文本对齐方法 — textAlign/textBaseline;
注意ctx.save()和ctx.restore()必须一起出现
<!DOCTYPE html>
<html lang="en">
<head>
    <meta charset="UTF-8">
    <title>Title</title>
    <style>
        canvas{
            /*border: 1px solid red;*/
            margin: auto;
            display: block;
        }
    </style>
</head>
<body>
<canvas id="canvas" width="1000" height="1000"></canvas>
<script>
    var deg = Math.PI / 180;
    var canvas = document.getElementById('canvas');
    var ctx = canvas.getContext('2d');
    function getRandomColor(){
        var r = parseInt(Math.random() * 256);
        var g = parseInt(Math.random() * 256);
        var b = parseInt(Math.random() * 256);
        return 'rgb('+ r +','+ g +','+ b +')';
    }

    //表里面需要动态改变的值,设置为属性
   function Clock(canvas,x,y,r,width,color,text){
        this.canvas = canvas;
        this.x = x;
        this.y = y;
        this.r = r;
        this.width = 5||width;
        this.color = getRandomColor()||color;
        this.text = text;
    }

    Clock.prototype.draw = function(type){
      var ctx = this.canvas.getContext('2d');
      var date = new Date();
      //判断画什么clock
      if(type == 'local'){
          var sec = date.getSeconds();
          var min = date.getMinutes();
          var hour = date.getHours();
      }else{
          var sec = date.getUTCSeconds();
          var min = date.getUTCMinutes();
          var hour = date.getUTCHours();
      }

      min = min + sec / 60;
      hour = hour > 12 ? (hour - 12):hour;
      hour = hour + min / 60 + sec /3600;
      //画表盘
        ctx.beginPath();
        //渐变背景色
        ctx.save();
        ctx.translate(this.x,this.y);
        var grd = ctx.createLinearGradient(this.r,0,-this.r,0);
        grd.addColorStop(0,'lightblue');
        grd.addColorStop(1,'white');
        ctx.fillStyle = grd;
        ctx.arc(0,0,this.r,0,360,false);
        ctx.fill();

        //圆的边框
        ctx.beginPath();
        ctx.arc(0,0,this.r,0,360,false);
        ctx.lineWidth = this.width;
        ctx.strokeStyle = this.color;
        ctx.stroke();

        //文字

        var arr = [12,3,6,9];
        ctx.font = '40px yahei';
        ctx.fillStyle = 'grey';
        ctx.save();
        ctx.fillStyle = 'grey';
        for(var i = 0; i < 4;i++){
            var x1 = Math.sin(i * 90 * deg) * (this.r - 70);
            var y1 = -Math.cos(i * 90 * deg) * (this.r - 70);
            ctx.textAlign = 'center';//水平方向位置
            ctx.textBaseline = 'middle';//垂直方向位置
            ctx.fillText(arr[i],x1,y1);
        }
        ctx.restore();

        //给字体设置样式
        ctx.font = '20px yahei';
        ctx.fillText(this.text,-50,400);

        //刻度,这里的x y只是比例缩小,可以是其他比例
        kdFn(ctx,60,6,-(this.r / 50)/2,-this.r,this.r/50,this.r / 10,'black');
        kdFn(ctx,12,30,-(this.r / 50)/2,-this.r,this.r/20,this.r/5,'black');
        //时针的长度和宽度
        var shiW = this.r / 25;
        var shiH = this.r * 0.8;
        var fenW = this.r / 50;
        var fenH = this.r * 0.9;
        var miaoW = this.r / 100;
        var miaoH = this.r;
        //指针的度数可以使用Math.sin()也可以使用我的方法,获取的时间乘每一格的度数,得出偏移的度数
        zhen(hour,30,shiW,shiH,'black');
        zhen(min,6,fenW,fenH,'black');
        zhen(sec,6,miaoW,miaoH,'black');


        ctx.restore();


    };

    //下方显示表的种类
    var clock = new Clock(canvas,250,250,200,5,getRandomColor(),'北京时间');
    var clock2 = new Clock(canvas,700,250,200,5,getRandomColor(),'世界时间');
    function animation(){
        ctx.clearRect(0,0,canvas.width,canvas.height);
        clock.draw('local');
        clock2.draw('world');
        window.requestAnimationFrame(animation);
    }
    animation();

    //封装刻度的函数
    function kdFn(ctx,num,de,x,y,w,h,color){
        for(var i = 0;i < num;i++){
            ctx.save();
            ctx.rotate(de * i * deg);
            ctx.fillStyle = color;
            ctx.fillRect(x,y,w,h);
            ctx.restore();
        }
    }

    //封装指针的函数
    function zhen(ele,count,w,h,color){
        ctx.save();
        ctx.rotate(count * ele * Math.PI / 180);
        ctx.fillStyle = color;
        ctx.fillRect(-w/2,-h,w,h);
        ctx.restore();
    }

</script>
</body>
</html>


 本文介绍了一种使用HTML5 Canvas API结合面向对象编程思想来创建动态表的方法。通过封装函数和利用Canvas特性如渐变填充、文本对齐等功能,实现了包括表盘、刻度、指针在内的各种元素,并演示了如何更新表的时间。


 544
544

 被折叠的 条评论
为什么被折叠?


