


1、要求y轴刻度为整数

yAxis: {
          type: "value",
          splitLine: {
            show: true,
            lineStyle: {
              color: ["#EAEAEA"],
              width: 1,
              type: "dashed",
            },
          },
          //以下设置y轴刻度为整数代码  valueDataAll是数组源,从里面找最大值用的
          minInterval: 1, //最小刻度是1
          splitNumber: 5, //段数是5
          min: 0, //最小是0
          interval: Math.ceil(Math.max.apply(null, valueDataAll) / 5) || 1,
          max: Math.ceil(Math.max.apply(null, valueDataAll) / 5) * 5 || 5,
          //
          //是否显示y轴线
          axisLine: {
            show: false,
          },
          //y轴字体设置
          axisLabel: {
            rotate: 0,
            show: true,
            textStyle: {
              fontSize: 12,
              // padding: [5,0,0,0],
              color: "#ADB0B6",
            },
          },
        },
2、控制图表下的legend只有一个时,不可以再点击,防止图表上空空的,不好看
myChart5.on('legendselectchanged', function (param) {
        var selected = [];
        for (var key in param.selected) {
            if (param.selected[key]) {
                selected.push(key);
            }
        }
        if (selected.length < 1) {
            myChart5.dispatchAction({
                type: 'legendSelect',
                name: param.name
            });
        }
});
3、legend 控制字数,超过一定字数做省略
legend: {
          show: true, //是否显示
          x: "center", //可设定图例在左、右、居中
          bottom: "15", //可设定图例在上、下、居中
          data: legendName,
          itemWidth: 12, // 图例图形宽度
          itemHeight: 9, // 图例图形高度
          // 截取名称前8个字
          formatter:function(name){
              return (name.length>5 ? (name.slice(0, 8)+'...') : name)
          },
          // 以下可以鼠标放上去 做提示
          // tooltip: {
          //     show: true
          // }
},
4、渐变:折线图线条区域的渐变,柱子的渐变

series: [
          //柱子的渐变
          {
            name: "加氢量",
            type: "bar",
            yAxisIndex: 0,
            barWidth: 7, //柱子的宽度
            itemStyle: {
              normal: {
                color: {
                  type: "linear",
                  x: 0,
                  y: 0,
                  x2: 0,
                  y2: 1,
                  colorStops: [
                    {
                      offset: 0,
                      color: "#2C98B6", // 0% 处的颜色
                    },
                    {
                      offset: 1,
                      color: "#269478", // 100% 处的颜色
                    },
                  ],
                  globalCoord: true, // 缺省为 false
                },
                //柱状图上的数字
                label: {
                  show: false,
                  position: "top",
                  // formatter: '{b}\n{c}'
                  formatter: function (a) {
                    return a.value;
                  },
                },
              },
            },
            data: valueData1,
          },
           //线条区域的渐变
          {
            name: "加氢次数",
            data: valueData2,
            type: "line",
            yAxisIndex: 1,
            // 让曲线更加圆滑
            // smooth: true,
            // symbol: "none",
            showSymbol: false,
            label: {
              normal: {
                show: false,
                color: "#ffffff",
              },
            },
            itemStyle: {
              normal: {
                color: "#ED7B2F",
                lineStyle: {
                  width: 2,
                  type: "solid",
                  // color: "#EC8139",
                  color: {
                    colorStops: [
                      {
                        offset: 0,
                        color: "#F7DFCF",
                      },
                      {
                        offset: 0.5,
                        color: "#ED7B2F",
                      },
                      {
                        offset: 1,
                        color: "#F7DFCF",
                      },
                    ],
                  },
                },
              },
            },
            areaStyle: {
              normal: {
                color: new this.$echarts.graphic.LinearGradient(0, 0, 0, 1, [
                  {
                    offset: 0,
                    color: "rgba(237,123,47, 0.2)",
                  },
                  {
                    offset: 0.34,
                    color: "rgba(237,123,47, 0.2)",
                  },
                  {
                    offset: 1,
                    color: "rgba(237,123,47, 0)",
                  },
                ]),
              },
            },
          },
],
5、环形进度条
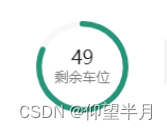
//利用极坐标系,柱状图来绘制环形进度条,以及进度条的加载动画
var option = {
      title: {
        text:44,
        subtext: '剩余车位',
        itemGap:2,
        textStyle:{
          //文字颜色
          color:'#222323',
          //字体风格,'normal','italic','oblique'
          fontStyle:'normal',
          //字体粗细 'normal','bold','bolder','lighter',100 | 200 | 300 | 400...
          fontWeight:'normal',
          //字体大小
       fontSize:18,
        },
        subtextStyle: {
          color: '#7E7E7E',
          fontSize: 13,
        },
        left: 'center',
        // top: 'center',
        // left:'46%',
        top:'26%',
      },
      angleAxis: {
        max: 100, // 满分
        clockwise: true, // 逆时针
          // 隐藏刻度线
        axisLine: {
          show: false
        },
        axisTick: {
          show: false
        },
        axisLabel: {
          show: false
        },
        splitLine: {
          show: false
        }
      },
      radiusAxis: {
        type: 'category',
          // 隐藏刻度线
        axisLine: {
          show: false
          },
          axisTick: {
          show: false
          },
          axisLabel: {
          show: false
          },
          splitLine: {
          show: false
          }
      },
      polar: {
        center: ['50%', '50%'],
        radius: ['88%', '100%'],
      },
      series: [{
        type: 'bar',
        showBackground: true,
        backgroundStyle: {
          color: '#F8F8F8'
        },
        data: [
         {name:'剩余车位占
         比',value:70,itemStyle:
         {color:'#269478'}}
        ],
        coordinateSystem: 'polar',
        roundCap: true,
        barWidth: 20,
        barGap: '-100%', // 两环重叠
        z: 2,
      }]

    }
6、环形展示多个数据,以白块相隔开

//
var option = {
      grid: {
        left: 0,
        top: 0,
      },
      title:{
          text:9,
          subtext: '车辆总计',
          itemGap:2,
          textStyle:{
            //文字颜色
            color:'#222323',
            //字体风格,'normal','italic','oblique'
            fontStyle:'normal',
            //字体粗细 'normal','bold','bolder','lighter',100 | 200 | 300 | 400...
            fontWeight:'normal',
            //字体大小
         fontSize:16,
          },
          subtextStyle: {
            color: '#7E7E7E',
            fontSize: 10,
          },
          // left:'46%',
          left: 'center',
          top:'26%',
      },
      series: [
        {
            name: '',
            silent:true, //取消点击图表高亮效果
            type: 'pie',
            center: ['50%', '50%'],
            radius: ['82%', '100%'],
            // radius: ['50%', '60%'],
            avoidLabelOverlap: false,
            label: {
                show: false,
                position: 'center'
            },
            emphasis: {
                label: {
                    show: false
                }
            },
            labelLine: {
                show: false
            },
            itemStyle: {
              normal:{
                borderWidth:1,
                borderColor:'#ffffff'
              },
            },
            data: [
             {name:'轻卡',value:7,itemStyle:
             {color:'#269478'}},
             {name:'重卡',value:2,itemStyle:
             {color:'#3AA7F9'}},
            ]
        }
      ]
    };
7、带环形背景色,且标注不同颜色的刻度表

drawEcharts1() {
      // 基于准备好的dom,初始化echarts实例
        let myChart1 = this.$echarts.init(this.$refs.echarts1,null,{ renderer : 'svg' })
        var totalCapacity = 500 //总库存
        var currentCapacity = 270 //当前库存
        var sevenCapacity = 133 //7mpa标记库存
        var tipCapacity = Number(sevenCapacity / totalCapacity)
        console.log(tipCapacity)
        var percentage = Number(currentCapacity / totalCapacity)
        console.log(percentage)
        if (percentage <= tipCapacity) {
          percentage = tipCapacity
        }
        var colorList = [
          [tipCapacity, '#FAC550'],
          [percentage, '#0388ED'],
          [1, '#171718']
        ]
        var option = {
          series: [
            {
              type: 'gauge',
              radius:'85%',
              min: 0,
              max: totalCapacity,
              startAngle: 210,
              endAngle: -30,
              //指针圆圈
              anchor: {
                show: true,
                showAbove: true,
                size: 10,
                itemStyle: {
                  borderWidth: 3,
                  borderColor:'#37B9FF',
                  color:'#fff'
                }
              },
              pointer: {
                width: 3,///仪表盘 指针 针宽度
                length: '45%',
                itemStyle: {
                  color:'#37B9FF',
                }
              },
              axisLine: {
                lineStyle: {
                  width: 8,
                  color: colorList
                }
              },
              //大刻度线
              splitLine: {
                length: 5, //大刻度线的长度
                distance: 5,
                lineStyle: {
                  width: 2,
                  color: '#979797'
                }
              },
              //去掉刻度线的小刻度
              axisTick: {
                distance: -30,
                length: 0,
                lineStyle: {
                  color: '#fff',
                  width: 2
                },
              },
              //刻度线上的文字
              axisLabel: {
                color: '#979797',
                distance: 15,
                fontSize: 10
              },
              detail: {
                show:false,
                // valueAnimation: true,
                // formatter: '200.00kg',
                // color: '#D6F1FF',
                // fontWeight:400,
                // fontSize: 20,
                // offsetCenter: ['0%', '39%']
              },
              data: [
                {
                  value: currentCapacity
                }
              ]
            }
          ]
        };
        // 绘制图表
        myChart1.setOption(option);
        window.addEventListener("resize",function (){
            myChart1.resize();
        });
    },
8、堆叠柱形图:展示总数,及每个柱子的值

drawEcharts1() {
      // 基于准备好的dom,初始化echarts实例
        let myChart1 = this.$echarts.init(this.$refs.echarts1,null,{ renderer : 'svg' })
        var xData = [];
        var valueData1 = []; //期初库存
        var valueData2 = []; //入库量
        var valueData3 = []; //总库存
        var valueData4 = []; //用氢量
        var valueData5 = []; //总库存-用氢量
        var arr = [{"value1":"189.68","value2":"401.80","value3":"206.77","itemDate":"05.13","value4":"195.04"},{"value1":"186.07","value2":"243.03","value3":"111.91","itemDate":"05.14","value4":"131.12"},{"value1":"166.58","value2":"283.12","value3":"119.04","itemDate":"05.15","value4":"164.08"},{"value1":"260.74","value2":"342.70","value3":"183.74","itemDate":"05.16","value4":"158.96"},{"value1":"119.97","value2":"384.21","value3":"221.24","itemDate":"05.17","value4":"162.97"},{"value1":"281.05","value2":"341.82","value3":"208.77","itemDate":"05.18","value4":"133.05"},{"value1":"219.86","value2":"392.86","value3":"258.17","itemDate":"05.19","value4":"134.69"}]
        arr && arr.forEach((el,index) => {
          xData.push(el.itemDate);
          el.value3= el.value3? Number(el.value3).toFixed(1) : 0
          el.value4= el.value4? Number(el.value4).toFixed(1) : 0
          el.value2= el.value2? Number(el.value2).toFixed(1) : 0
          el.value1= el.value1? Number(el.value1).toFixed(1) : 0

          valueData1.push(el.value3);
          valueData2.push(el.value4);
          //
          var obj = {
              value:el.value2,
              animation: true,
              coord: [index, el.value2]
          }
          valueData3.push(obj);
          //
          valueData4.push(el.value1);
          var minCount = (Number(el.value2) - Number(el.value1)).toFixed(1)
          valueData5.push(minCount);
        })
        var option = {
          tooltip: {
            trigger: 'axis',
            backgroundColor: "rgba(5, 24, 46, 0.7)", //设置背景颜色
            textStyle: {
              color: "white" //设置文字颜色
            },
            borderColor: "rgba(5, 24, 46, 0.7)", //设置边框颜色
            axisPointer: {
              type: 'shadow',
              shadowStyle: {
                color: 'rgba(45,236,246, 0.05)'
              }
            },
            formatter: function(params) {
                let str = '';
                params.splice(3,1)
                params.forEach((item, idx) => {
                  str += `${item.marker}${item.seriesName}: ${item.data}`
                  switch (idx){
                      case 0:
                          str += '';
                          break;
                      case 1:
                          str += '';
                          break;
                      default:
                          str += ''
                  }
                  str += idx === params.length -1? '': '<br/>'
                })
                return str
            }
          },
          legend: {
            itemWidth: 12, //修改icon图形大小
            itemHeight: 6, //修改icon图形大小
            top:12,
            right:12,
            textStyle:{
              height: 12,
              rich: {
                a: {
                  verticalAlign: 'bottom',
                },
              },
              fontSize: 12,//字体大小
              color: '#ffffff'//字体颜色
           },
           data:['期初库存','入库量','用氢量'],
          //  selected: {
          //     '用氢量2': false,
          //  },
          },
          grid: {
            left: '4%',
            right: '4%',
            bottom: '5%',
            top: '20%',
            containLabel: true
          },
          xAxis: [
            {
              type: 'category',
              axisLabel: {
              textStyle: {
                  color: 'rgba(255,255,255,0.6)',
                  fontSize: '10px',
                }
              },
              "axisTick":{
                "show":false //隐藏x轴刻度
              },
              data: xData
            }
          ],
          yAxis: [
            {
              type: 'value',
              axisLabel: {
                show: false,
                textStyle: {
                  color: 'rgba(255,255,255,0.6)',
                  fontSize: '10px',
                }
              },
              splitLine: {
                  show: false,
                  lineStyle:{
                      color: ['#555F78'],
                      width: 1,
                      type: 'dashed'
                  }
              },
            }
          ],
          series: [
            {
              name: '期初库存',
              type: 'bar',
              stack: 'Ad',
              emphasis: {
                focus: 'none'
              },
              barWidth: 20,
              barGap: '0', // Make series be overlap
              itemStyle: { //柱子颜色
                color:'#0388ED'
              },
              label: {
                show: true,
                position: 'insideTop',
                fontSize: 8,
                color:'#ffffff'
              },
              data: valueData1
            },
            {
              name: '入库量',
              type: 'bar',
              stack: 'Ad',
              emphasis: {
                focus: 'none'
              },
              barWidth: 20,
              barGap: '0', // Make series be overlap
              itemStyle: { //柱子颜色
                color:'#FAC550'
              },
              label: {
                show: true,
                position: 'insideTop',
                fontSize: 8,
                color:'#010A11',
              },
              markPoint:{ // 标记的图形
                    symbol:'',
                    symbolSize:[0, 0],// 容器大小
                    symbolOffset:[0,0],//位置偏移
                    itemStyle:{
                      normal:{
                        label:{
                            show: true,
                            color:'#ffffff',
                            fontSize:8,
                            position:'top',
                            distance:6,
                        },
                      }

                    },
                    data: valueData3
                },
              data: valueData2
            },
            {
              name: '用氢量',
              type: 'bar',
              stack: 'Bd',
              emphasis: {
                focus: 'none'
              },
              barWidth: 20,
              barGap: '0', // Make series be overlap
              itemStyle: { //柱子颜色
                color:'#2DECF6'
              },
              label: {
                show: true,
                position: 'insideTop',
                fontSize: 8,
                color:'#010A11'
              },
              data: valueData4
            },
            {
              name: '用氢量2',
              type: 'bar',
              stack: 'Bd',
              emphasis: {
                focus: 'none'
              },
              barWidth: 20,
              // barMinHeight:10,
              barGap: '0', // Make series be overlap
              // showBackground: true,
              // backgroundStyle: {
              //   color: 'rgba(180, 180, 180, 0.2)',
              // },
              itemStyle: { //柱子颜色
                color:'transparent',
                borderWidth:1,
                borderType:'dashed',
                borderColor:'#555F78',

              },
              label: {
                show: true,
                verticalAlign: 'middle',
                fontSize: 8,
                color:'#ffffff',
              },
              data: valueData5
            },

          ]
        };
        // 绘制图表
        myChart1.setOption(option);
        window.addEventListener("resize",function (){
            myChart1.resize();
        });
    },
9、柱状折线图:加自定义数字展示的图片

drawEcharts1() {
      // 基于准备好的dom,初始化echarts实例
        let myChart1 = this.$echarts.init(this.$refs.echarts1,null,{ renderer : 'svg' })
        var xData = [];
        var valueData1 = []; //损益量
        var valueData2 = []; //损益量marker
        var valueData3 = []; //损益率
        var valueData4 = []; //损益率marker
        var arr1 = [{"itemDate":"05.13","value1":"9.73"},{"itemDate":"05.14","value1":"7.41"},{"itemDate":"05.15","value1":"-8.60"},{"itemDate":"05.16","value1":"7.19"},{"itemDate":"05.17","value1":"8.76"},{"itemDate":"05.18","value1":"-5.86"},{"itemDate":"05.19","value1":"5.23"}]
        arr1 && arr1.forEach((el,index) => {
          xData.push(el.itemDate);
          //
          valueData1.push(el.value1); //损益量
          //
          var obj = {
              index:index,
              value:el.value1,
              animation: true,
              coord: [index, el.value1]
          }
          valueData2.push(obj);  //损益量marker
        })
        var arr2 = [{"itemDate":"05.13","value1":"2.1"},{"itemDate":"05.14","value1":"1.2"},{"itemDate":"05.15","value1":"2.3"},{"itemDate":"05.16","value1":"1.5"},{"itemDate":"05.17","value1":"4.1"},{"itemDate":"05.18","value1":"3.5"},{"itemDate":"05.19","value1":"1.8"}]
        arr2 && arr2.forEach((el,index) => {
          //
          valueData3.push(el.value1); //损益率
          //
          var obj = {
              index:index,
              value:el.value1,
              animation: true,
              coord: [index, el.value1]
          }
          valueData4.push(obj);  //损益率marker

        })
        var option = {
          tooltip: {
            trigger: 'axis',
            backgroundColor: "rgba(5, 24, 46, 0.7)", //设置背景颜色
            textStyle: {
              color: "white" //设置文字颜色
            },
            borderColor: "rgba(5, 24, 46, 0.7)", //设置边框颜色
            axisPointer: {
              type: 'shadow',
              shadowStyle: {
                color: 'rgba(45,236,246, 0.05)'
              }
            },
            formatter: function(params) {
                let str = '';
                params.forEach((item, idx) => {
                    str += `${item.marker}${item.seriesName}: ${item.data}`
                    switch (idx){
                        case 0:
                            str += 'kg';
                            break;
                        case 1:
                            str += '%';
                            break;
                        default:
                            str += 'kg'
                    }
                    str += idx === params.length -1? '': '<br/>'
                })
                return str
            }
          },
          grid: {
            left: '4%',
            right: '4%',
            bottom: '5%',
            top: '23%',
            containLabel: true
          },
          xAxis: {
            type: 'category',
            axisLabel: {
              textStyle: {
                color: 'rgba(255,255,255,0.6)',
                fontSize: '10px',
              }
            },
            "axisLine":{
                //"show":false  //隐藏x轴线
                lineStyle:{//改变xy轴线条的颜色
                  color:"#555F78"
                }
              },
              "axisTick":{
                "show":false //隐藏x轴刻度
              },
            data:  xData,

          },
          yAxis: {
            type: 'value',
            name: 'kg',
            nameTextStyle:{//y轴上方单位的颜色
              color: 'rgba(255,255,255,0.6)',
              fontSize: 10,
              padding:[0,30,0,0]
            },
            axisLabel: {
              textStyle: {
                color: 'rgba(255,255,255,0.6)',
                fontSize: 10,
              }
            },
            splitLine: {
              lineStyle: {
                type: 'dashed',
                color: '#555F78',
              }
            },
          },
          series: [
            {
              name: '损益量',
              type: 'bar',
              label: {
                show: false,
                position: 'top',
              },
              itemStyle: {
                normal:{
                  //柱形图圆角,初始化效果
                  barBorderRadius:15,
                  color: function(params) {
                    if (params.data > 0) {
                        return '#0388ED'
                    } else {
                        return '#FAC550'
                    }
                  },
                },
              },
              barWidth: 10,
              markPoint:{ // 标记的图形
                    symbol:'roundRect',
                    symbol:'image://' + echarts_icon1,
                    // symbolSize:[100, 30],// 容器大小
                    // 根据当前某项数据确定标注容器宽高。若为0,固定为30;若非0,其数值位数少于等于4位,固定为 60 ,否则 位数*14 作为其宽高
                    symbolSize: (e, e1) => e ? e.toString().length <= 4 ? [43,38] : [e.toString().length * 11,38] : [43,38],
                    // symbolOffset:[0,-10],//位置偏移
                    symbolOffset:(e, e1) => e ? e >= valueData4[e1.data.index].value && Math.abs(valueData4[e1.data.index].value - e) <= 1  ? [0,-20] : [0,-10] : [0,-10],//位置偏移
                    itemStyle:{
                      normal:{
                        label:{
                            show: true,
                            color:'#ffffff',
                            fontSize:8,
                            position:'top',
                            distance:-20,
                            formatter: (a) => {
                              return a.value + 'kg'
                            },
                        },
                      }

                    },
                    data: valueData2
                },
              data: valueData1
            },
            {
              name: '损益率',
              type: 'line',
              label: {
                show: false,
                position: 'top'
              },
              symbol:'circle',
              symbolSize: 10,
              color:'#2EE8F5',
              markPoint:{ // 标记的图形
                    symbol:'roundRect',
                    // symbol:'image://http://img30.360buyimg.com/poprx/jfs/t23662/172/668395134/12944/5653b1ff/5b3c2737N3d867c2f.png',
                    symbol:'image://' + echarts_icon1,
                    // symbolSize:[100, 30],// 容器大小
                    // 根据当前某项数据确定标注容器宽高。若为0,固定为30;若非0,其数值位数少于等于4位,固定为 60 ,否则 位数*14 作为其宽高
                    symbolSize: (e, e1) => e ? e.toString().length <= 4 ? [43,38] : [e.toString().length * 11,38] : [43,38],
                    // symbolOffset:[0,-15],//位置偏移
                    symbolOffset:(e, e1) => e ? e > valueData2[e1.data.index].value && Math.abs(valueData2[e1.data.index].value - e) <= 1  ? [0,-25] : [0,-15] : [0,-15],//位置偏移
                    itemStyle:{
                      normal:{
                        label:{
                            show: true,
                            color:'#ffffff',
                            fontSize:8,
                            position:'top',
                            distance:-20,
                            formatter: (a) => {
                              return a.value + '%'
                            },
                        },
                      }

                    },
                    data: valueData4
                },
              data: valueData3
            }
          ]
        };
        // 绘制图表
        myChart1.setOption(option);
        window.addEventListener("resize",function (){
            myChart1.resize();
        });
    },
10、进度条 展示百分比

var option = {
          grid: {
            left: '0',
            right: '0%',
            bottom: '0%',
            top: 0,
            // containLabel: true
          },
          xAxis: {
            show:false, //不显示x轴相关信息
          },
          yAxis: [
            {
              show:false,
              type: 'category',
              data: [],
              axisTick:{show:false}, //不显示刻度线
              axisTick:{
                  show:false
              },
              axisLine:{
                  show:false
              },
              inverse:true
            },
            {
              show:false,
              type: 'category',
              data: [],
              axisTick:{show:false}, //不显示刻度线
              axisTick:{
                  show:false
              },
              axisLine:{
                  show:false
              },
              inverse:true
            },

          ],
          series: [
            {
              name: '条',
              yAxisIndex:0,
              type: 'bar',
              data: valueData1,
              // 修改第一条柱子的圆角
              itemStyle:{
                  normal:{
                      barBorderRadius:2,
                      color:color
                  },
              },
              // 柱子之间的间距
              barCategoryGap:0,
              // 柱子之间的宽度
              barWidth:10,
            },
            {
              name: '框',
              yAxisIndex:1,
              type: 'bar',
              data: [100],
              // 柱子之间的间距
              barCategoryGap:0,
              // 柱子之间的宽度
              barWidth:10,
              itemStyle:{
                  color:"none", //填充色
                  borderColor:"rgba(255,255,255,0.5)",
                  borderWidth:1,
                  barBorderRadius:2
              },
              // 显示柱子内的文字
              label:{
                  show:true,
                  position:"insideRight",
                  formatter:""+ valueData1[0] + "%",
                  color:'#ffffff',
                  fontSize:'10px'
                  // {c} 会自动解析为data中的数据
              }
            }
          ]
        };
11、面积堆叠图
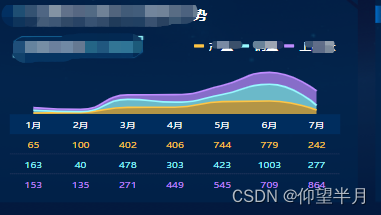
var option = {
          grid: {
            left: '0%',
            right: '0%',
            bottom: '17%',
            top: '18%',
            containLabel: true
          },
          legend: {
            itemWidth: 10, //修改icon图形大小
            itemHeight: 4, //修改icon图形大小
            top:4,
            right:0,
            itemGap:6,
            icon:'roundRect',
            lineStyle:{
              cap:'round'
            },
            textStyle:{
              height: 12,
              rich: {
                a: {
                  verticalAlign: 'bottom',
                },
              },
              fontSize: 12,//字体大小
              color: '#ffffff'//字体颜色
           },
           data:['产量','销量','上险量'],
          },
          //X轴
          xAxis: [{
              show: true, //不显示坐标轴线、坐标轴刻度线和坐标轴上的文字
              axisTick: {
                show: false // 不显示坐标轴刻度线
              },
              // boundaryGap: false,
              type: "category",
              axisLabel: {
                interval: 0,
                fontSize: "10",
                color: "#FFFFFF",
              },
              axisLine: {
                show: false,
                lineStyle: {
                  color: "#1F335A",
                },
              },
              data: xData,
            },
            {
              type: 'category',
              position: 'bottom',
              // boundaryGap: false,
              axisLabel: {
                interval: 0,
                fontSize: "10",
                color: "#FFC544",
              },
              offset: 24,
              axisPointer: {
                type: 'none'
              },
              axisTick:{
                show: false
              },
              axisLine:{
                show: false
              },
              data: valueData1,
            },
            {
              type: 'category',
              position: 'bottom',
              // boundaryGap: false,
              axisLabel: {
                interval: 0,
                fontSize: "10",
                color: "#97F9FF",
              },
              offset: 48,
              axisPointer: {
                type: 'none'
              },
              axisTick:{
                show: false
              },
              // axisLine:{
              //   show: false
              // },
              axisLine: {
                show: true,
                lineStyle: {
                  color: "#1F335A",
                  type: 'dotted',
                },
              },
              data: valueData2,
            },
            {
              type: 'category',
              position: 'bottom',
              // boundaryGap: false,
              axisLabel: {
                interval: 0,
                fontSize: "10",
                color: "#C08CFF",
              },
              offset: 72,
              axisPointer: {
                type: 'none'
              },
              axisTick:{
                show: false
              },
              // axisLine:{
              //   show: false
              // },
              axisLine: {
                show: true,
                lineStyle: {
                  color: "#1F335A",
                  type: 'dotted',
                },
              },
              data: valueData3,
            },
          ],
          yAxis: {
            show: false, //不显示坐标轴线、坐标轴刻度线和坐标轴上的文字
            splitNumber: 3,
            axisLabel: {
              show: false
            },
            splitLine: {
              show: false,
              lineStyle: {
                type: 'dotted',
                color: '#1F335A'
              }
            }
          },
          series: [
            {
              name:'产量',
              type: "line",
              stack: 'Total',
              symbol: "none",
              smooth: true,
              itemStyle: {
                color: '#FFC544',    //小圆点和线的颜色
                borderWidth:0,
                borderType:'solid'
              },
              areaStyle: { // 区域颜色
                color:'#FFC544',
              },
              data: valueData1,
            },
            {
              name:'销量',
              type: "line",
              stack: 'Total',
              symbol: "none",
              smooth: true,
              itemStyle: {
                color: '#97F9FF',    //小圆点和线的颜色
                borderWidth:0,
                borderType:'solid'
              },
              areaStyle: { // 区域颜色
                color:'#97F9FF',
              },
              data: valueData2,
            },
            {
              name:'上险量',
              stack: 'Total',
              type: "line",
              symbol: "none",
              smooth: true,
              itemStyle: {
                color: '#C08CFF',    //小圆点和线的颜色
                borderWidth:0,
                borderType:'solid'
              },
              areaStyle: { // 区域颜色
                color:'#C08CFF',
              },
              data: valueData3,
            },
          ],
        };
12、自动排行榜的柱状图,并带图片
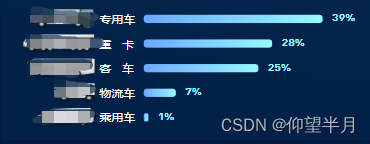
var option = {
          grid: {
            left: '0%',
            right: '10%',
            bottom: '0%',
            top: '0%',
            containLabel: true
          },
          //X轴
          xAxis: {
            splitLine: {
                show: false,
            },
            axisLine: {
                show: false,
            },
            axisTick: {
                show: false
            },
            axisLabel: {
                show: false
            }
          },
          yAxis: {
            type: "category",
            //升序
            inverse: true,
            splitLine: {
                show: false,
            },
            axisLine: {
                show: false,
            },
            axisTick: {
                show: false
            },
            axisLabel: {
              show: true,
              interval: 0,
              padding: [0, 0, 0, -115],
              textStyle: {
                  color: '#ffffff',
                  fontSize: 12,
                  align: "left"
              },
              //函数模板
              formatter:function (value,index) {
                var carTypeCode = carList[index].carTypeCode;
                if (carTypeCode == "zyc") {
                  return "{a|} " + value + "";
                } else if (carTypeCode == "zk") {
                  value = '重   卡'
                  return "{b|} " + value + "";
                } else if (carTypeCode == "kc") {
                  value = '客   车'
                  return "{c|} " + value + "";
                } else if (carTypeCode == "wlc") {
                  return "{d|} " + value + "";
                } else if (carTypeCode == "cyc") {
                  return "{e|} " + value + "";
                }
                return "{f|} " + value + "";
              },
              rich: {
                a: {
                    width: 75,
                    height: 23,
                    verticalAlign: 'center',
                    align:'left',
                    backgroundColor: {
                      image: car1
                    },
                },
                b: {
                    width: 75,
                    height: 23,
                    verticalAlign: 'center',
                    align:'left',
                    backgroundColor: {
                        image: car2
                    }
                },
                c: {
                    width: 75,
                    height: 23,
                    verticalAlign: 'center',
                    align:'left',
                    backgroundColor: {
                        image: car3
                    }
                },
                d: {
                    width: 75,
                    height: 23,
                    verticalAlign: 'center',
                    align:'left',
                    backgroundColor: {
                        image: car4
                    }
                },
                e: {
                    width: 75,
                    height: 23,
                    verticalAlign: 'center',
                    align:'left',
                    backgroundColor: {
                        image: car5
                    }
                },
                f: {
                    width: 75,
                    height: 23,
                    verticalAlign: 'center',
                    align:'left',
                    color: "#fff"
                }
              },
            },
            data: yData,
          },
          series: [
            {
              //柱状图自动排序,排序自动让Y轴名字跟着数据动
              realtimeSort: true,
              name: "数量",
              type: "bar",
              barWidth: 10,
              barGap: 10,
              smooth: true,
              animation: true,
              valueAnimation: true,
              //Y轴数字显示部分
              label: {
                normal: {
                  show: true,
                  position: "right",
                  valueAnimation: true,
                  offset: [5, -2],
                  textStyle: {
                    color: "#97F9FF",
                    fontSize: 12,
                    fontWeight:"bold",
                    fontFamily:'din-bold',
                  },
                  formatter: function (a) {
                    var str = a.value + '%';
                    return str;
                  },
                },
              },
              itemStyle: {
                emphasis: {
                  barBorderRadius: 4,
                },
                //颜色样式部分
                normal: {
                  barBorderRadius: 4,
                  color: this.$echarts.graphic.LinearGradient(0, 0, 1, 0, [
                    { offset: 0, color: "#6DA7FF" },
                    { offset: 1, color: "#97F9FF" },
                  ]),
                },
              },
              data: valueData,
            },
          ],
        };
13、map地图
1、热力图
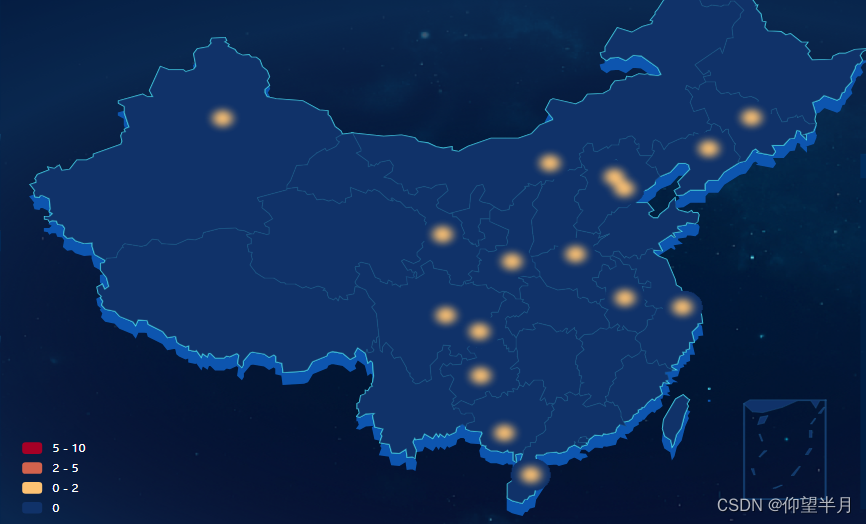
2、区域着色
用的regions

用的visualMap


 4万+
4万+


 被折叠的 条评论
为什么被折叠?
被折叠的 条评论
为什么被折叠?
 到【灌水乐园】发言


