


- 安装: npm install echarts
- 参考资源:https://echarts.apache.org/handbook/zh/get-started/
- 创建组件ModeCharts.vue
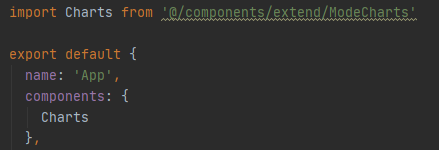
- 要用到图图表的页面引入
<template>
  <div>
    <div id="main" style="width: 600px;height:400px;">
    </div>
  </div>
</template>
<script>
  import * as echarts from 'echarts'

  export default {
    mounted() {
      // 官方流程
      // 基于准备好的dom,初始化echarts实例
      var myChart = echarts.init(document.getElementById('main'));
      // 指定图表的配置项和数据
      var option = {
        title: {
          text: 'ECharts 入门示例'
        },
        tooltip: {},
        legend: {
          data: ['销量']
        },
        xAxis: {
          data: ['衬衫', '羊毛衫', '雪纺衫', '裤子', '高跟鞋', '袜子']
        },
        yAxis: {},
         series: [
          {
            name: '销量',
            type: 'bar',
            data: [5, 20, 36, 10, 10, 20]
          }
        ]
      }
       // 使用刚指定的配置项和数据显示图表。
      myChart.setOption(option);
    }

  }

</script>
<style>

</style>
视频:https://www.bilibili.com/video/BV1hQ4y127BV?from=search&seid=7937061890823919345&spm_id_from=333.337.0.0


 1326
1326


 被折叠的 条评论
为什么被折叠?
被折叠的 条评论
为什么被折叠?
 到【灌水乐园】发言


