


1、安装dagre-d3、d3
yarn add dagre-d3 d3
本篇使用d3js v6.x版本,从v3到v4开始用法变化较大
2、画图(html演示)
<!DOCTYPE html>
<html lang="en">
<head>
    <meta charset="UTF-8">
    <meta http-equiv="X-UA-Compatible" content="IE=edge">
    <meta name="viewport" content="width=device-width, initial-scale=1.0">
    <!-- ①引入 -->
    <script src="d3.min.js"></script>
    <script src="dagre-d3.min.js"></script>
    <style>
        text {
        font-weight: 300;
        font-family: "Helvetica Neue", Helvetica, Arial, sans-serf;
        font-size: 14px;
        }

        .node rect {
        stroke: #999;
        fill: #fff;
        stroke-width: 1.5px;
        cursor: pointer;
        }

        .edgePath path {
        stroke: #333;
        stroke-width: 1.5px;
        }

        .clusters rect {
        fill: #d3d7e8;stroke: #999;stroke-width: 1.5px;
        cursor: pointer;
        }

        .label {
        cursor: pointer;
        }
    </style>
</head>
<body>
    <svg width=1200 height=800></svg>
    <script>
        const draw = () => {
            // ②创建 graph 对象
            const graph = new dagreD3.graphlib.Graph({compound:true}) // compound:true为分组必须配置!*
                .setGraph({
                rankdir:'TB',  // 流程图从下向上显示,默认'TB',可取值'TB'、'BT'、'LR'、'RL'
                // zoom: 1,
		        // ranker: "network-simplex",//连线算法
		        // nodesep: 70, // 节点之间间距
		        // ranksep: 100, // 层与层之间的间距
                })
                .setDefaultEdgeLabel(() => ({}));
            // 定义节点
            graph.setNode(1, {label: "节点1"});
            graph.setNode(2, {label: "节点2"});
            graph.setNode(3, {label: "节点3"});
            graph.setNode(4, {label: '节点4-组'});
            // 定义连线
            graph.setEdge(1, 2, {/*属性*/});
            // 定义分组
            graph.setParent(2, 4);
            graph.setParent(3, 4);
            // ③选择 svg 并添加一个g元素作为绘图容器
            // new dagreD3.render()创建渲染器
            const svg = d3.select(`svg`);
            // 在绘图容器上运行渲染器
            svg.append("g").call(new dagreD3.render(), graph)
            .attr("transform", `translate(20,20)`);
        }
        draw()
    </script>
</body>
</html>
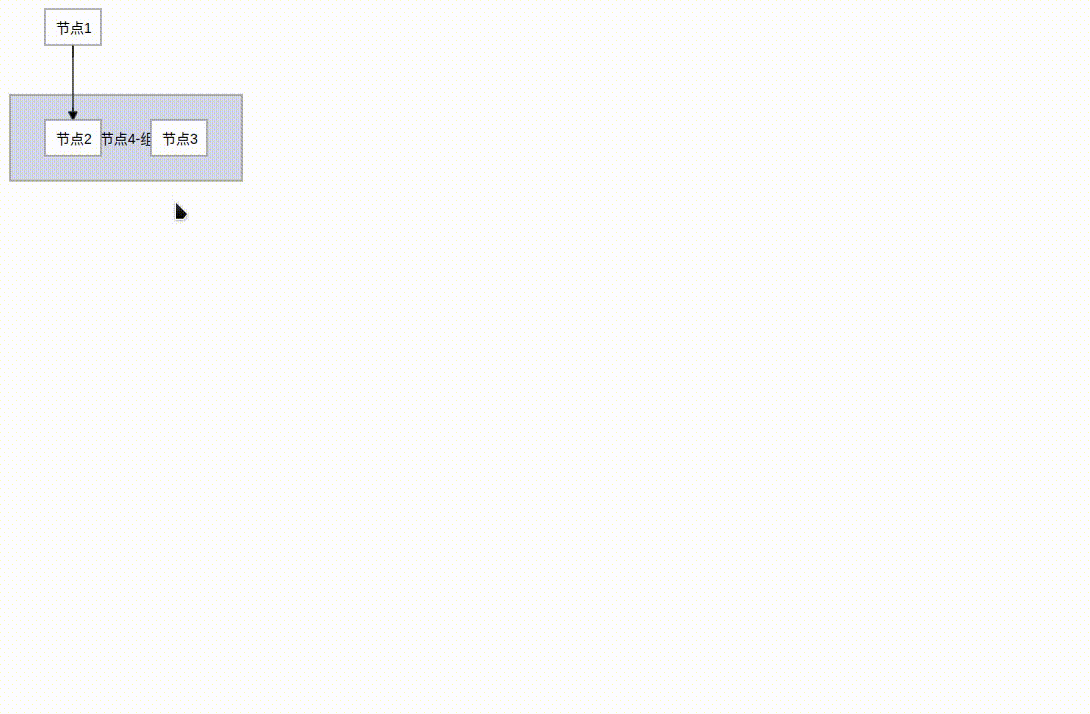
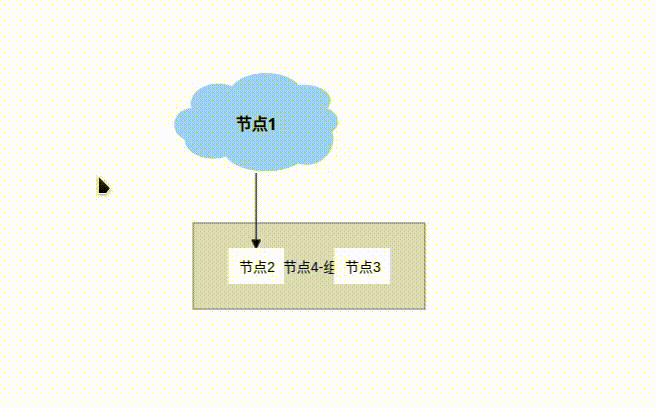
运行结果:

此为最简洁的流程图
参考来源:https://observablehq.com/@fchugunov/hello-dagre
此例子有tooltip等鼠标事件效果
基本图像画好后,除节点、连线样式外的其他附加效果均应在渲染render之后进行
还应会使用d3js画svg图
从零学习d3可参考:svg教程、D3(一)、D3(二)、D3(三)、D3(四)
只能说相当有用
附加效果:
d3操作
1、缩放和移动
// 在绘图容器上运行渲染器
const container = svg.append("g").call(new dagreD3.render(), graph)
	.attr("transform", `translate(20,20)`);

var zoom = d3
    .zoom() // 缩放支持
    .scaleExtent([0.5, 2]) // 缩放范围
    .on("zoom", function (current) {
        container.attr("transform", current.transform);
    });
svg.call(zoom); // 缩放生效
.scaleExtent可以使用传递数组来限制缩放,[min, max]其中min是最小比例因子,max是最大比例因子;使用.translateExtent指定[[x0, y0], [x1, y1]]限制用户平移的范围。
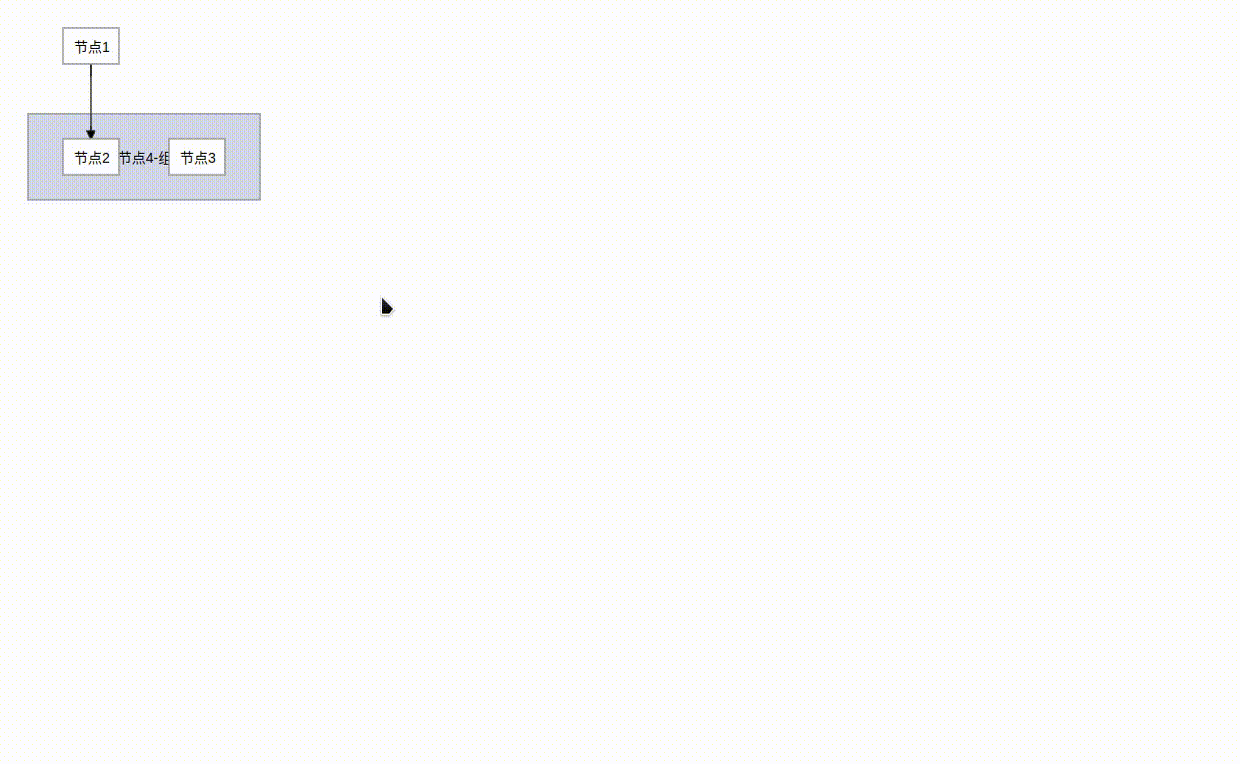
运行结果:
2、过渡动画居中
let { clientWidth, clientHeight } = svg._groups[0][0];
let { width, height } = graph.graph();
let initScale = 1;
svg
    .transition()
    .duration(1000) // 1s完成过渡
    .call(
    zoom.transform,
    d3.zoomIdentity // 居中显示
        .translate((clientWidth - width * initScale) / 2, (clientHeight - height * initScale) / 2)
        .scale(initScale) // 默认缩放比例
    );
.transform 将变换设置为给定的变换。(d3.zoomIdentity)用于创建缩放变换。)
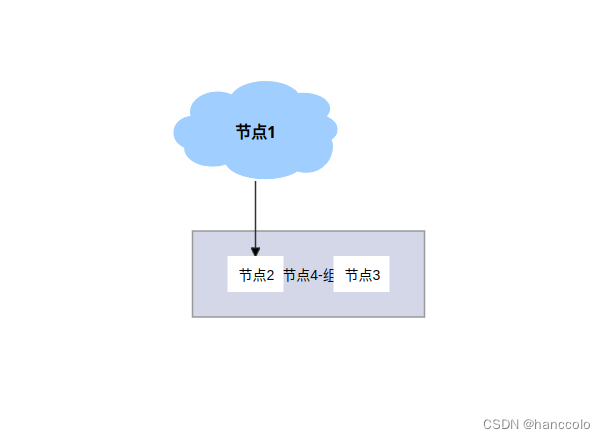
刷新运行结果:
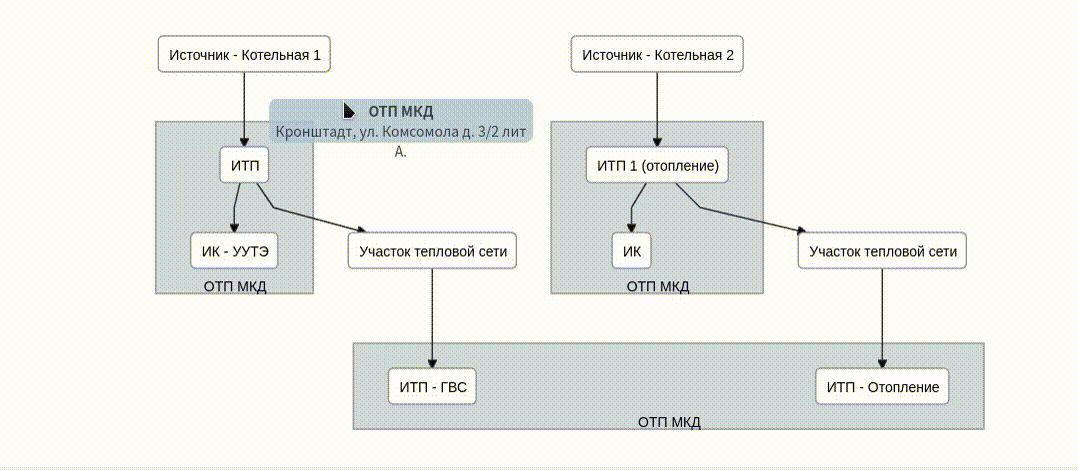
节点属性(引用图片,利用label):
g.setNode(1, {
	// shape:"",  // 节点形状rect(长方形,默认)、circle(圆)、ellipse(椭圆)、diamond(菱形)
	label: `
	<div style="width:164px;height:100px;display:flex;background-image:url(/topoicon/wild.svg);background-size: cover">
	  <span id=1 class='nodeA' style="margin:auto">节点1</span>
	</div>
	`,
	labelType: "html",  //必须!*
	style: "cursor: pointer", // 节点样式,可设置节点的颜色填充、节点边框
	labelStyle: "font-weight:bold;cursor: pointer", // 节点标签样式, 可设置节点标签的文本样式(颜色、粗细、大小)
	padding:0 // 默认10
	// rx: 5, // 设置圆角
    // ry: 5,
    // paddingBottom: 0
    });
运行结果:
连线的属性:
g.setEdge(edge.fromId, middleNode, {
	//curve: d3.curveStepBefore , //d3.curveBasis, // 设置为贝塞尔曲线
	style: "stroke: #a0cfff; fill: none; stroke-width: 2px", // 连线样式
	arrowheadStyle: "fill: #a0cfff;stroke: #a0cfff;", //箭头样式,可以设置箭头颜色
	arrowhead: "vee" //箭头形状,可以设置 normal,vee,undirected 三种样式,默认为 normal
});
上面的参考例子tooltip跟随鼠标位置,修改为相对于节点位置:
(原)跟随鼠标:
var tooltipDiv = d3.select("body").append("div")
                .attr("class", "tooltip")
                .style("opacity", 0);

            var showTooltip = function(e){
                var currentNode = graph.node(e.target.id);
                tooltipDiv.transition()
                .duration(200)
                .style("opacity", .9);
                tooltipDiv.html("<br/>"  + (currentNode.name ?? ""))
                .style("left", (e.pageX) + "px")
                .style("top", (e.pageY - 60) + "px");
            }

            var hideTooltip = function(e){
                tooltipDiv.transition()
                .duration(500)
                .style("opacity", 0);
            }

            svg.selectAll("g.node,g.cluster").on("mouseenter", showTooltip).on("mouseout", hideTooltip);
(修改后)相对节点:
// node数据加如类型,供后面用
graph.setNode(2, {id:2,type:'child',label: "节点2",name:'节点2',});


var tooltipDiv = d3.select("body").append("div")
    .attr("class", "tooltip")
    .style("opacity", 0);
//增加的片段1
let nodeWObject = { root: 164, parent: 232, child: 56 };
let nodeHObject = { root: 100, parent: 86, child: 36 };

var showTooltip = function(e){
    var currentNode = graph.node(e.target.id);
    //增加的片段2
    let scale = d3.zoomTransform(svg.node()).k; //缩放比例
    let containerX = d3.zoomTransform(svg.node()).x; //缩放和移动后的容器的水平移动距离
    let containerY = d3.zoomTransform(svg.node()).y; //...垂直...
    let nodeX = currentNode.x;  //节点相对于容器边缘的水平距离
    let nodeY = currentNode.y;  //...垂直...
    let nodeW = nodeWObject[currentNode.type]; //节点宽,不同类型区分
    let nodeH = nodeWObject[currentNode.type];  //节点高
    let popoverHeigh = 44;  //tooltip高度

    tooltipDiv.transition()
    .duration(200)
    .style("opacity", .9);
    tooltipDiv.html("<br/>"  + (currentNode.name ?? ""))
    .style("left", 20 + containerX + (nodeX + nodeW / 2) * scale + 'px') //20是body的margin
    .style("top", 20 + containerY + nodeY * scale - popoverHeigh / 2 + 'px');
}

var hideTooltip = function(e){
    tooltipDiv.transition()
    .duration(500)
    .style("opacity", 0);
}

svg.selectAll("g.node,g.cluster").on("mouseenter", showTooltip).on("mouseout", hideTooltip);
参考资料:https://observablehq.com/@fchugunov/hello-dagre
https://blog.csdn.net/qq_57956183/article/details/134708333


 3673
3673


 被折叠的 条评论
为什么被折叠?
被折叠的 条评论
为什么被折叠?
 到【灌水乐园】发言


