


 本文展示了如何在Vue项目中利用dagre-d3库绘制流程图,包括设置节点和边,实现从下到上的布局,添加拖拽缩放功能以及鼠标悬停时显示tooltip节点详细信息。示例代码详细解释了每个关键步骤,提供了一个完整的流程图组件实现。
1、插件版本
"d3": "^7.8.0",
"dagre-d3": "^0.6.4",
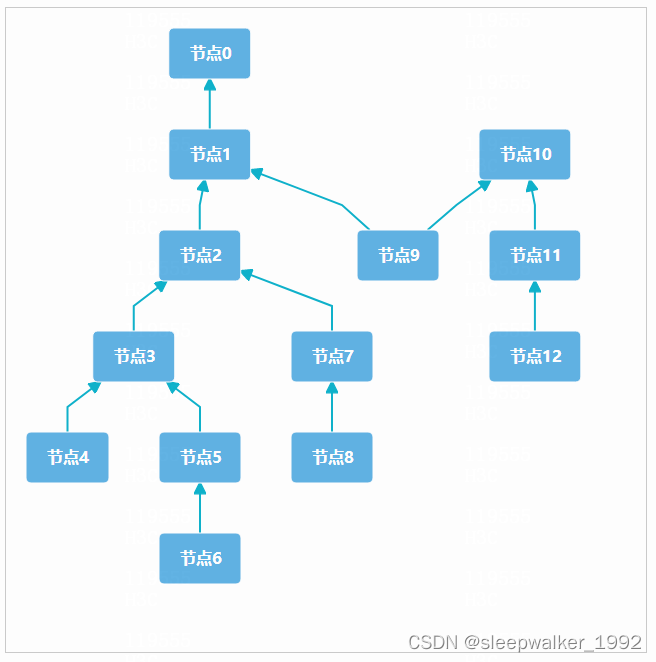
2、绘制简单的流程图
<template>
  <div style="border: 1px solid #ccc; padding: 20px; width: 600px">
    <svg class="dagre" width="600" height="600">
        <g class="container"></g>
    </svg>
  </div>
</template>

<script>
import dagreD3 from 'dagre-d3';
import * as d3 from 'd3';

export default {
  name: 'dagre',
  data() {
    return {
        nodes: [
          {
            id: 0,
            nodeName: '节点0',
          },
          {
            id: 1,
            nodeName: '节点1',
          },
          {
            id: 2,
            nodeName: '节点2',
          },
          {
            id: 3,
            nodeName: '节点3',
          },
          {
            id: 4,
            nodeName: '节点4',
          },
          {
            id: 5,
            nodeName: '节点5',
          },
          {
            id: 6,
            nodeName: '节点6',
          },
          {
            id: 7,
            nodeName: '节点7',
          },
          {
            id: 8,
            nodeName: '节点8',
          },
          {
            id: 9,
            nodeName: '节点9',
          },
          {
            id: 10,
            nodeName: '节点10',
          },
          {
            id: 11,
            nodeName: '节点11',
          },
          {
            id: 12,
            nodeName: '节点12',
          },
        ],
        edges: [
          {
            start: 1,
            end: 0,
          },
          {
            start: 2,
            end: 1,
          },
          {
            start: 3,
            end: 2,
          },
          {
            start: 4,
            end: 3,
          },
          {
            start: 5,
            end: 3,
          },
          {
            start: 6,
            end: 5,
          },
          {
            start: 7,
            end: 2,
          },
          {
            start: 8,
            end: 7,
          },
          {
            start: 9,
            end: 1,
          },
          {
            start: 9,
            end: 10,
          },
          {
            start: 11,
            end: 10,
          },
          {
            start: 12,
            end: 11,
          },
        ],
    };
  },
  mounted() {
    this.draw();
  },
  methods: {
    // 绘制简单的流程图
    draw() {
        // 创建 Graph 对象
        const g = new dagreD3.graphlib.Graph().setGraph({
                    rankdir: 'BT', // 流程图从下向上显示,默认'TB',可取值'TB'、'BT'、'LR'、'RL'
                  }).setDefaultEdgeLabel(function() { return {}; });

        // Graph添加节点
        this.nodes.forEach(node => {
            g.setNode(node.id, {
                id: node.id,
                label: node.nodeName,
                shape: 'rect',  //节点形状,可以设置rect(长方形),circle,ellipse(椭圆),diamond(菱形) 四种形状,还可以使用render.shapes()自定义形状
                style: 'fill:#61b2e4;stroke:#fff',  //节点样式,可设置节点的颜色填充、节点边框
                labelStyle: 'fill: #fff;font-weight:bold',  //节点标签样式, 可设置节点标签的文本样式(颜色、粗细、大小)
                rx: 5,  // 设置圆角
                ry: 5,  // 设置圆角
                paddingBottom: 15,
                paddingLeft: 20,
                paddingRight: 20,
                paddingTop: 15,
            });
        });

        // Graph添加节点之间的连线
        if(this.nodes.length > 1) {
            this.edges.forEach(edge => {
                g.setEdge(edge.start, edge.end, {
                    style: 'stroke: #0fb2cc; fill: none; stroke-width: 2px',  // 连线样式
                    arrowheadStyle: 'fill: #0fb2cc;stroke: #0fb2cc;',  //箭头样式,可以设置箭头颜色
                    arrowhead: 'normal',  //箭头形状,可以设置 normal,vee,undirected 三种样式,默认为 normal
                })
            });
        }

        // 获取要绘制流程图的绘图容器
        const container = d3.select('svg.dagre').select('g.container');

        // 创建渲染器
        const render = new dagreD3.render();
        // 在绘图容器上运行渲染器绘制流程图
        render(container, g);
    },
  },
};
</script>

<style>

</style>
效果图:
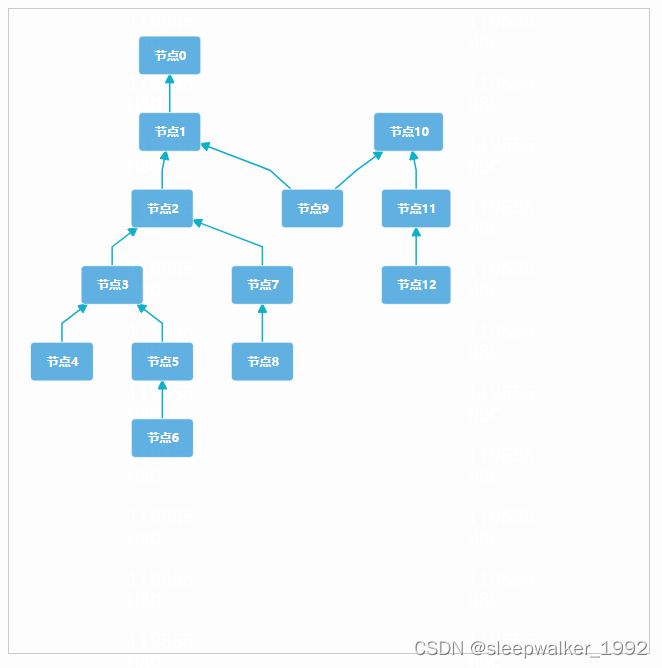
3、拖拽缩放
        // 拖拽缩放 "d3": "^7.8.0"
        const svg = d3.select('svg.dagre');
        let zoom = d3.zoom().on('zoom', function (current) {
          container.attr('transform', current.transform);
        });
        svg.call(zoom);
限制缩放范围
        let zoom = d3.zoom().scaleExtent([0.5, 2]).on('zoom', function (current) {
          container.attr('transform', current.transform);
        });
d3版本v5时的写法
        // 拖拽缩放 ("d3": "^5.15.0",)
        const svg = d3.select('svg.dagre');
        let zoom = d3.zoom().scaleExtent([0.5, 2]).on('zoom', function () {
          container.attr('transform', d3.event.transform);
        });
        svg.call(zoom);
效果:
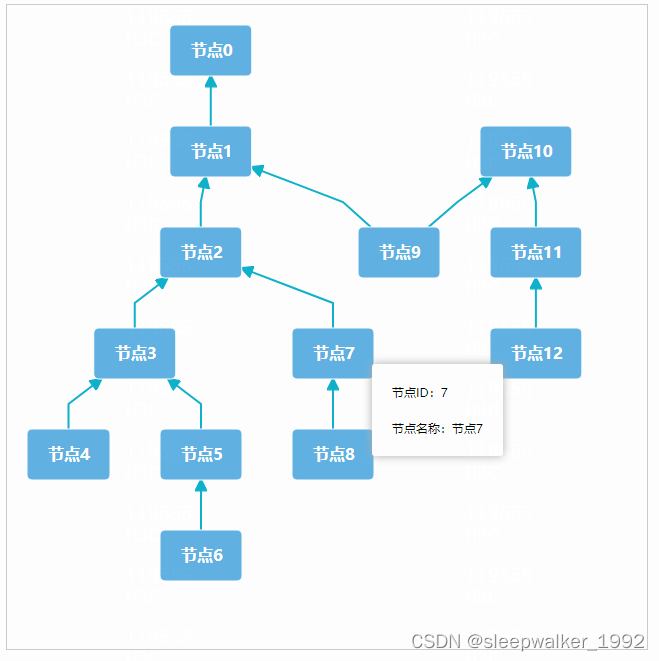
4、鼠标悬停显示隐藏tooltip
        // 鼠标悬停显示隐藏tooltip
        const that = this;
        const tooltipBox = that.$refs.tooltip;
        container.on('mouseover', e => {
          that.currentNode = that.nodes.filter(item => item.id === Number(e.target.__data__))[0];
          tooltipBox.style.display = 'block';
          tooltipBox.style.top = e.clientY + 20 + 'px';
          tooltipBox.style.left = e.clientX + 'px';
        }).on('mouseout', function () {
          tooltipBox.style.display = 'none';
        })
效果:
5、完整代码
<template>
  <div style="border: 1px solid #ccc; padding: 20px; width: 600px">
    <svg class="dagre" width="600" height="600">
        <g class="container"></g>
    </svg>
    <div ref="tooltip" class="tooltip">
      <div>节点ID:{{currentNode.id}}</div>
      <div>节点名称:{{currentNode.nodeName}}</div>
    </div>
  </div>
</template>

<script>
import dagreD3 from 'dagre-d3';
import * as d3 from 'd3';

export default {
  name: 'dagre',
  data() {
    return {
        currentNode: {
          id: null,
          nodeName: '',
        },
        nodes: [
          {
            id: 0,
            nodeName: '节点0',
          },
          {
            id: 1,
            nodeName: '节点1',
          },
          {
            id: 2,
            nodeName: '节点2',
          },
          {
            id: 3,
            nodeName: '节点3',
          },
          {
            id: 4,
            nodeName: '节点4',
          },
          {
            id: 5,
            nodeName: '节点5',
          },
          {
            id: 6,
            nodeName: '节点6',
          },
          {
            id: 7,
            nodeName: '节点7',
          },
          {
            id: 8,
            nodeName: '节点8',
          },
          {
            id: 9,
            nodeName: '节点9',
          },
          {
            id: 10,
            nodeName: '节点10',
          },
          {
            id: 11,
            nodeName: '节点11',
          },
          {
            id: 12,
            nodeName: '节点12',
          },
        ],
        edges: [
          {
            start: 1,
            end: 0,
          },
          {
            start: 2,
            end: 1,
          },
          {
            start: 3,
            end: 2,
          },
          {
            start: 4,
            end: 3,
          },
          {
            start: 5,
            end: 3,
          },
          {
            start: 6,
            end: 5,
          },
          {
            start: 7,
            end: 2,
          },
          {
            start: 8,
            end: 7,
          },
          {
            start: 9,
            end: 1,
          },
          {
            start: 9,
            end: 10,
          },
          {
            start: 11,
            end: 10,
          },
          {
            start: 12,
            end: 11,
          },
        ],
    };
  },
  mounted() {
    this.draw();
  },
  methods: {
    // 绘制简单的流程图
    draw() {
        // 创建 Graph 对象
        const g = new dagreD3.graphlib.Graph().setGraph({
                    rankdir: 'BT', // 流程图从下向上显示,默认'TB',可取值'TB'、'BT'、'LR'、'RL'
                  }).setDefaultEdgeLabel(function() { return {}; });

        // Graph添加节点
        this.nodes.forEach(node => {
            g.setNode(node.id, {
                id: node.id,
                label: node.nodeName,
                shape: 'rect',  //节点形状,可以设置rect(长方形),circle,ellipse(椭圆),diamond(菱形) 四种形状,还可以使用render.shapes()自定义形状
                style: 'fill:#61b2e4;stroke:#fff',  //节点样式,可设置节点的颜色填充、节点边框
                labelStyle: 'fill: #fff;font-weight:bold',  //节点标签样式, 可设置节点标签的文本样式(颜色、粗细、大小)
                rx: 5,  // 设置圆角
                ry: 5,  // 设置圆角
                paddingBottom: 15,
                paddingLeft: 20,
                paddingRight: 20,
                paddingTop: 15,
            });
        });

        // Graph添加节点之间的连线
        if(this.nodes.length > 1) {
            this.edges.forEach(edge => {
                g.setEdge(edge.start, edge.end, {
                    style: 'stroke: #0fb2cc; fill: none; stroke-width: 2px',  // 连线样式
                    arrowheadStyle: 'fill: #0fb2cc;stroke: #0fb2cc;',  //箭头样式,可以设置箭头颜色
                    arrowhead: 'normal',  //箭头形状,可以设置 normal,vee,undirected 三种样式,默认为 normal
                })
            });
        }

        // 获取要绘制流程图的绘图容器
        const container = d3.select('svg.dagre').select('g.container');

        // 创建渲染器
        const render = new dagreD3.render();
        // 在绘图容器上运行渲染器绘制流程图
        render(container, g);

        // 拖拽缩放
        const svg = d3.select('svg.dagre');
        let zoom = d3.zoom().scaleExtent([0.5, 2]).on('zoom', current => {
          container.attr('transform', current.transform);
        });
        svg.call(zoom);


        // 鼠标悬停显示隐藏tooltip
        const that = this;
        const tooltipBox = that.$refs.tooltip;
        container.on('mouseover', e => {
          that.currentNode = that.nodes.filter(item => item.id === Number(e.target.__data__))[0];
          tooltipBox.style.display = 'block';
          tooltipBox.style.top = e.clientY + 20 + 'px';
          tooltipBox.style.left = e.clientX + 'px';
        }).on('mouseout', function () {
          tooltipBox.style.display = 'none';
        })
    },
  },
};
</script>

<style scoped>
.tooltip {
     position: absolute;
     font-size: 12px;
     background-color: white;
     border-radius: 3px;
     box-shadow: rgb(174, 174, 174) 0px 0px 10px;
     cursor: pointer;
     display: none;
     padding:10px;
 }

.tooltip>div {
     padding: 10px;
 }
</style>


 1695
1695

 被折叠的 条评论
为什么被折叠?
被折叠的 条评论
为什么被折叠?
 到【灌水乐园】发言


