


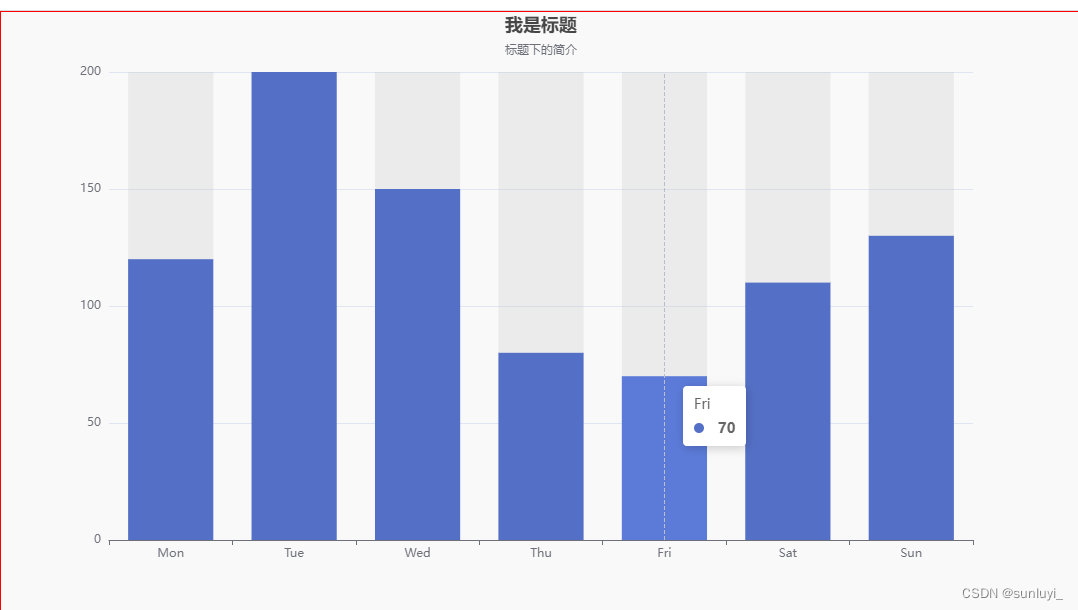
基础柱状图
<template>
	<div class="index">
		<div ref="main" class="main"></div>
	</div>
</template>

<script>
	import * as echarts from 'echarts';
	export default {
		data() {
			return {
				option: {}
			}
		},
		mounted() {
			this.option = {
				title: {
					text: '我是标题',
					subtext: '标题下的简介',
					left: 'center'
				},
				tooltip: {
					trigger: 'axis'
				},
				xAxis: {
					type: 'category',
					data: ['Mon', 'Tue', 'Wed', 'Thu', 'Fri', 'Sat', 'Sun']
				},
				yAxis: {
					type: 'value'
				},
				series: [{
					data: [120, 200, 150, 80, 70, 110, 130],
					type: 'bar',
					showBackground: true,
					backgroundStyle: {
						color: 'rgba(180, 180, 180, 0.2)'
					}
				}]
			};
			var myChart = echarts.init(this.$refs.main);
			this.option && myChart.setOption(this.option);
			window.addEventListener('resize', myChart.resize);
		},
		methods: {}
	}
</script>

<style scoped lang="less">
	.index {
		.main {
			height: 600px;
			border: 1px solid red;
		}
	}
</style>
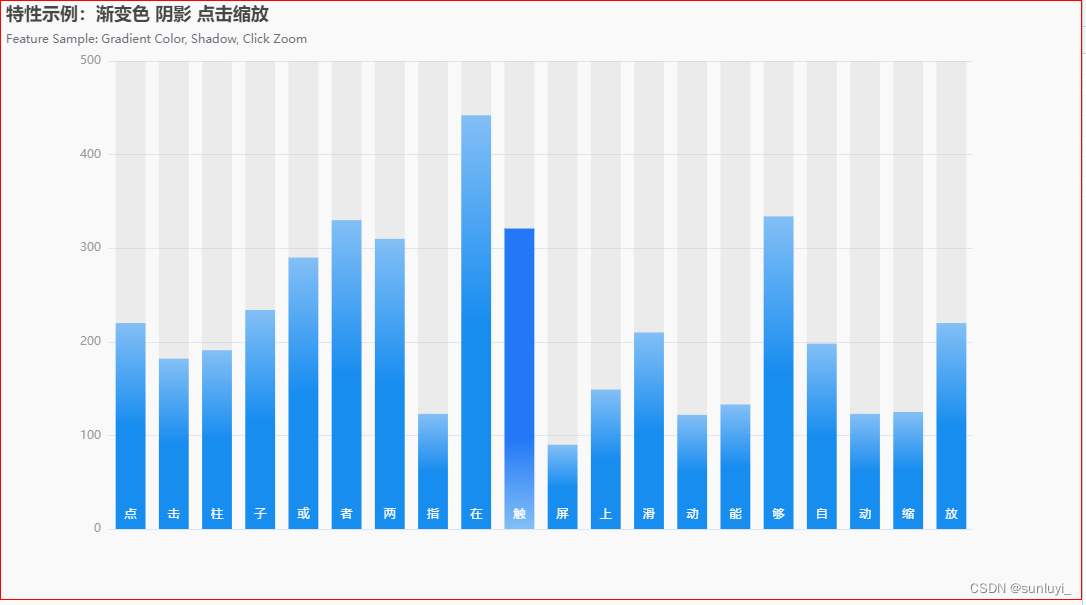
柱状图:渐变色 阴影 点击缩放
<template>
	<div class="index">
		<div ref="main" class="main"></div>
	</div>
</template>

<script>
	import * as echarts from 'echarts';
	export default {
		data() {
			return {
				option: {}
			}
		},
		mounted() {
			let dataAxis = ['点', '击', '柱', '子', '或', '者', '两', '指', '在', '触', '屏', '上', '滑', '动', '能', '够', '自', '动', '缩',
				'放'
			];
			let data = [220, 182, 191, 234, 290, 330, 310, 123, 442, 321, 90, 149, 210, 122, 133, 334, 198, 123, 125, 220];
			let yMax = 500;
			let dataShadow = [];
			for (let i = 0; i < data.length; i++) {
				dataShadow.push(yMax);
			}
			this.option = {
				title: {
					text: '特性示例:渐变色 阴影 点击缩放',
					subtext: 'Feature Sample: Gradient Color, Shadow, Click Zoom'
				},
				xAxis: {
					data: dataAxis,
					axisLabel: {
						inside: true,
						color: '#fff'
					},
					axisTick: {
						show: false
					},
					axisLine: {
						show: false
					},
					z: 10
				},
				yAxis: {
					axisLine: {
						show: false
					},
					axisTick: {
						show: false
					},
					axisLabel: {
						color: '#999'
					}
				},
				dataZoom: [{
					type: 'inside'
				}],
				series: [{
					type: 'bar',
					showBackground: true,
					itemStyle: {
						color: new echarts.graphic.LinearGradient(0, 0, 0, 1, [{
								offset: 0,
								color: '#83bff6'
							},
							{
								offset: 0.5,
								color: '#188df0'
							},
							{
								offset: 1,
								color: '#188df0'
							}
						])
					},
					emphasis: {
						itemStyle: {
							color: new echarts.graphic.LinearGradient(0, 0, 0, 1, [{
									offset: 0,
									color: '#2378f7'
								},
								{
									offset: 0.7,
									color: '#2378f7'
								},
								{
									offset: 1,
									color: '#83bff6'
								}
							])
						}
					},
					data: data
				}]
			};


			var myChart = echarts.init(this.$refs.main);
			this.option && myChart.setOption(this.option);

			const zoomSize = 6;
			myChart.on('click', function(params) {
				console.log(dataAxis[Math.max(params.dataIndex - zoomSize / 2, 0)]);
				myChart.dispatchAction({
					type: 'dataZoom',
					startValue: dataAxis[Math.max(params.dataIndex - zoomSize / 2, 0)],
					endValue: dataAxis[Math.min(params.dataIndex + zoomSize / 2, data.length - 1)]
				});
			});

			window.addEventListener('resize', myChart.resize);
		},
		methods: {}
	}
</script>

<style scoped lang="less">
	.index {
		.main {
			height: 600px;
			border: 1px solid red;
		}
	}
</style>


 1161
1161


 被折叠的 条评论
为什么被折叠?
被折叠的 条评论
为什么被折叠?
 到【灌水乐园】发言


