


首先是老师布置的作业,叫我们练习区域生长,种子可以手动选取,但最好自动找出来。于是乎我就像挑战一下,感觉网上例程很多的样子,比如:
本人搜了半天,网上虽然看似很多,但就其根本就只有这一个。于是就用了一下其中的找种子环节(函数)。
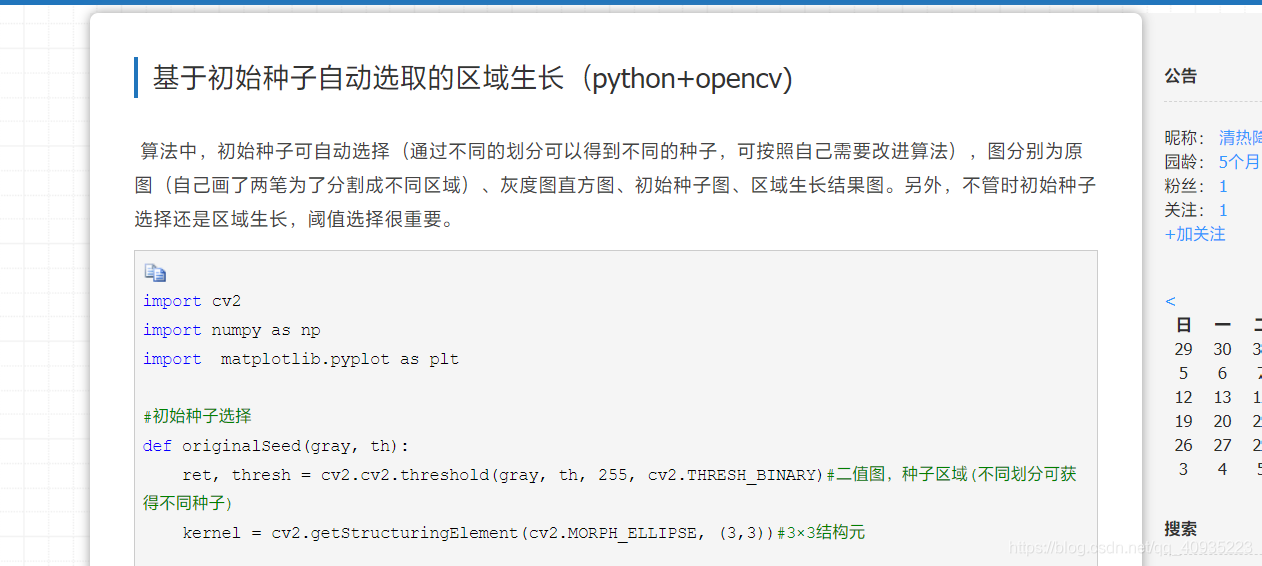
#初始种子选择
def originalSeed(gray, th):
    ret, thresh = cv2.cv2.threshold(gray, th, 255, cv2.THRESH_BINARY)#二值图,种子区域(不同划分可获得不同种子)
    kernel = cv2.getStructuringElement(cv2.MORPH_ELLIPSE, (3,3))#3×3结构元

    thresh_copy = thresh.copy() #复制thresh_A到thresh_copy
    thresh_B = np.zeros(gray.shape, np.uint8) #thresh_B大小与A相同,像素值为0

    seeds = [ ] #为了记录种子坐标

    #循环,直到thresh_copy中的像素值全部为0
    while thresh_copy.any():

        Xa_copy, Ya_copy = np.where(thresh_copy > 0) #thresh_A_copy中值为255的像素的坐标
        thresh_B[Xa_copy[0], Ya_copy[0]] = 255 #选取第一个点,并将thresh_B中对应像素值改为255

        #连通分量算法,先对thresh_B进行膨胀,再和thresh执行and操作(取交集)
        for i in range(200):
            dilation_B = cv2.dilate(thresh_B, kernel, iterations=1)
            thresh_B = cv2.bitwise_and(thresh, dilation_B)

        #取thresh_B值为255的像素坐标,并将thresh_copy中对应坐标像素值变为0
        Xb, Yb = np.where(thresh_B > 0)
        thresh_copy[Xb, Yb] = 0

        #循环,在thresh_B中只有一个像素点时停止
        while str(thresh_B.tolist()).count("255") > 1:
            thresh_B = cv2.erode(thresh_B,  kernel, iterations=1) #腐蚀操作

        X_seed, Y_seed = np.where(thresh_B > 0) #取处种子坐标
        if X_seed.size > 0 and Y_seed.size > 0:
            seeds.append((X_seed[0], Y_seed[0]))#将种子坐标写入seeds
        thresh_B[Xb, Yb] = 0 #将thresh_B像素值置零
    return seeds
while{
	for(200次){
	}
	whlie(xxx > 1){
	}
}
是这种结构。。。其中那个for中间是一次腐蚀操作和并集操作。对于这么多像素都要做一次,这运算量可想而知。但我大概是了解这串操作是什么意思。大概是像通过腐蚀操作将此时图像中的连通域变小,然后一次次地迭代,找出每一个连通域的种子。
那么有没有更加方便地操作呢?
本人学图像处理时间也不多,深度也不深,但我想选取种子肯定得与连通域有关。我们想尽量选择每个连通域中较为中间地点,而且每个连通域尽量只取一个点来进行区域生长最合适。多的话会重复生长,浪费时间。那么,个人认为主要确实得通过腐蚀或者用其他方法使连通域变小,直到小到一定程度,取其中的一个点,把此连通域删除。即一层一层腐蚀,删除连通域进行迭代。但本人想了半天不知道怎么做。。。判断函数+删除连通域函数就很难马上实现(作业马上就要交了)。所以在网上搜了一下,发现了有连通域的专属操作:
connectedComponentsWithStats(image[,
							 labels[,
							 stats[,
							 centroids[,
							 connectivity[,
							 ltype]]]]])
#-> retval, labels, stats, centroids
返回值里有一个centroids------质心?这个函数就是对于每个连通域进行轮廓的提取操作,质心刚好能实现在中间取一个点的操作。这里有人会问:质心不一定在连通域中怎么办?emmmm确实是一个问题。大家有好的方法可以在评论区说一下。那我现在就先将就一下。于是我把质心提取出来,又由于种子的位置一定是int型的,所以做个转化。提取seed的代码如下:
#初始种子选择
def originalSeed(gray):
    ret, img1 = cv2.threshold(gray, 245, 255, cv2.THRESH_BINARY)  # 二值图,种子区域(不同划分可获得不同种子)
    retval, labels, stats, centroids = cv2.connectedComponentsWithStats(img1)#进行连通域操作,取其质点
    centroids = centroids.astype(int)#转化为整数
    # seed = []
    # for i  in range(img1.shape[0]):
    #     for j in range(img1.shape[1]):
    #         if(img1[i,j] == 255):
    #             seed.append([i,j])

    return centroids
然后再结合老师原来的例程就可以实现了,还要记得将threshold设置成5。所以全程序如下:
import cv2
import numpy as np
import matplotlib.pyplot as plt


#求两个点的差值
def getGrayDiff(image,currentPoint,tmpPoint):
    return abs(int(image[currentPoint[0],currentPoint[1]]) - int(image[tmpPoint[0],tmpPoint[1]]))
#区域生长算法
def regional_growth (gray,seeds,threshold=5) :
    #每次区域生长的时候的像素之间的八个邻接点
    connects = [(-1, -1), (0, -1), (1, -1), (1, 0), (1, 1), \
                        (0, 1), (-1, 1), (-1, 0)]
    threshold = threshold #生长时候的相似性阈值,默认即灰度级不相差超过15以内的都算为相同
    height, weight = gray.shape
    seedMark = np.zeros(gray.shape)
    seedList = []
    for seed in seeds:
        if(seed[0] < gray.shape[0] and seed[1] < gray.shape[1] and seed[0]  > 0 and seed[1] > 0):
            seedList.append(seed)   #将添加到的列表中
    print(seedList)
    label = 1	#标记点的flag
    while(len(seedList)>0):     #如果列表里还存在点
        currentPoint = seedList.pop(0)  #将最前面的那个抛出
        seedMark[currentPoint[0],currentPoint[1]] = label   #将对应位置的点标志为1
        for i in range(8):  #对这个点周围的8个点一次进行相似性判断
            tmpX = currentPoint[0] + connects[i][0]
            tmpY = currentPoint[1] + connects[i][1]
            if tmpX < 0 or tmpY < 0 or tmpX >= height or tmpY >= weight:    #如果超出限定的阈值范围
                continue    #跳过并继续
            grayDiff = getGrayDiff(gray,currentPoint,(tmpX,tmpY))   #计算此点与像素点的灰度级之差
            if grayDiff < threshold and seedMark[tmpX,tmpY] == 0:
                seedMark[tmpX,tmpY] = label
                seedList.append((tmpX,tmpY))
    return seedMark

#初始种子选择
def originalSeed(gray):
    ret, img1 = cv2.threshold(gray, 245, 255, cv2.THRESH_BINARY)  # 二值图,种子区域(不同划分可获得不同种子)
    retval, labels, stats, centroids = cv2.connectedComponentsWithStats(img1)#进行连通域操作,取其质点
    centroids = centroids.astype(int)#转化为整数
    # seed = []
    # for i  in range(img1.shape[0]):
    #     for j in range(img1.shape[1]):
    #         if(img1[i,j] == 255):
    #             seed.append([i,j])

    return centroids

# if __name__ == "__main__":
img = cv2.imread('10.2.png')
img = cv2.cvtColor(img, cv2.COLOR_BGR2GRAY)
seed = originalSeed(img)
img = regional_growth(img,seed)

# 用来正常显示中文标签
plt.rcParams['font.sans-serif'] = ['SimHei']
# 图像显示
plt.figure(figsize=(10, 5))  # width * height
plt.subplot(111), plt.imshow(img, cmap='gray'), plt.title('区域生长以后'), plt.axis("off")
plt.show()
print("ok...")
效果如下:

右边虽然有点噪声,但可以通过滤波器消去。
然后如果你老师也是付老师的话,那就点个赞或者评论一下吧!哈哈哈!


 716
716


 被折叠的 条评论
为什么被折叠?
被折叠的 条评论
为什么被折叠?
 到【灌水乐园】发言


