


近段时间由于工作要求接触了prometheus 做了以下总结
什么是Prometheus?
Prometheus是由SoundCloud开发的开源监控报警系统和时序列数据库(TSDB)。Prometheus使用Go语言开发,是Google BorgMon监控系统的开源版本。
2016年由Google发起Linux基金会旗下的原生云基金会(Cloud Native Computing Foundation), 将Prometheus纳入其下第二大开源项目。
Prometheus目前在开源社区相当活跃。
Prometheus和Heapster(Heapster是K8S的一个子项目,用于获取集群的性能数据。)相比功能更完善、更全面。Prometheus性能也足够支撑上万台规模的集群。
Prometheus的特点
• 多维度数据模型。
• 灵活的查询语言。
• 不依赖分布式存储,单个服务器节点是自主的。
• 通过基于HTTP的pull方式采集时序数据。
• 可以通过中间网关进行时序列数据推送。
• 通过服务发现或者静态配置来发现目标服务对象。
• 支持多种多样的图表和界面展示,比如Grafana等。
官网地址:https://prometheus.io/
架构图

监控端部署Prometheus Service
选择合适版本下载安装https://github.com/prometheus/prometheus/blob/v2.23.0/RELEASE.md
给prometheus加权限
chmod 777 prometheus

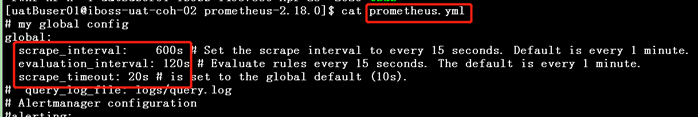
prometheus.yml采集配置文件
scrape_interval 采集间隔
evaluation_interval 触发告警检测的时间
添加采集主机ip
prometheus.yml
  - job_name: 'process'
    static_configs:
    - targets: ['192.168.xxx.xxx:9256']
  - job_name: 'node'
    static_configs:
    - targets: ['192.168.xxx.xxx:9100']
  - job_name: 'jmx'
    static_configs:
    - targets: ['192.168.xxx.xxx:8099']
  - job_name: 'mysql'
    static_configs:
    - targets: ['192.168.xxx.xxx:9104']
 - job_name: 'oracle'
    static_configs:
    - targets: ['192.168.xxx.xxx:9161']
  - job_name: 'redis'
    static_configs:
    - targets: ['192.168.xxx.xxx:9121']
  - job_name: 'kafak'
    static_configs:
    - targets: ['192.168.xxx.xxx:9308']
  - job_name: 'zookeeper'
    static_configs:
    - targets: ['192.168.xxx.xxx:9141']
重新加载配置文件
reload.sh
curl -XPOST http://localhost:9090/-/reload
start.sh启动采集
nohup ./prometheus --config.file=prometheus.yml - 最低0.47元/天 解锁文章


 459
459


 被折叠的 条评论
为什么被折叠?
被折叠的 条评论
为什么被折叠?
 到【灌水乐园】发言


