


Here are examples taken from the corresponding manual:
Example using the subfig package:
\usepackage{graphicx}   % 论文中加图片
\usepackage[caption=false,font=normalsize,labelfont=normalsize,textfont=normalsize]{subfig}   % 子图


\begin{figure}%
\centering
\subfloat[First.]{...}\qquad
\subfloat[Second figure.]{...}\\
\subfloat[Third.]{\label{3figs-c}...}%
\caption{Three sub-floats.}
\label{3figs}
\end{figure}
我的使用案例
\begin{figure*}%
\centering
\subfloat[CIFAR-10]{\label{fig:cifar-time}\includegraphics[width=0.45\textwidth]{figure/time/time_list_rep_cifar10.pdf}} \qquad
\subfloat[CelebA]{\label{fig:celeba-time}\includegraphics[width=0.45\textwidth]{figure/time/time_list_rep_celebA.pdf}}\\
\subfloat[ImageNet32]{\label{fig:imn32-time}\includegraphics[width=0.45\textwidth]{figure/time/time_list_rep_imagenet32.pdf}} \qquad
\subfloat[ImageNet64]{\label{fig:imn64-time}\includegraphics[width=0.45\textwidth]{figure/time/time_list_rep_imagenet64.pdf}} \\
\subfloat{\includegraphics[width=0.99\textwidth]{figure/time/legend.pdf}}
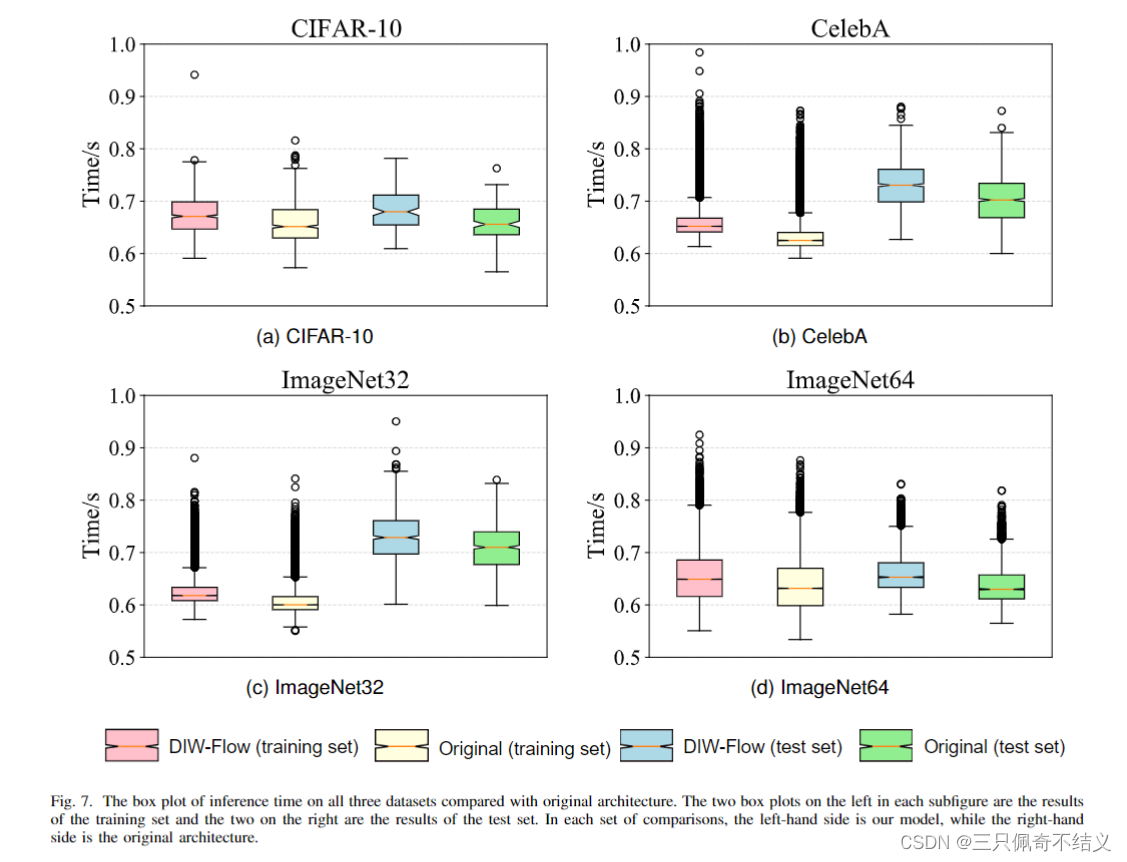
\caption{The box plot of inference time on all three datasets compared with original architecture. The two box plots on the left in each subfigure are the results of the training set and the two on the right are the results of the test set. In each set of comparisons, the left-hand side is our model, while the right-hand side is the original architecture.}
\label{fig:time}
\end{figure*}
Example using the subfloat package:
\begin{subfigures}
\label{fig:fig1a2}
%
\begin{figure}\centering
\fbox{fig. 1}
\caption{This is the first figure}\label{fig:fig1}
\end{figure}
%
\begin{figure}\centering
\fbox{fig. 2}
\caption{This is the second figure}\label{fig:fig2}
\end{figure}
%
\end{subfigures}
没看错,
subfig包主要的命令为subfloat
\begin{figure*}这个*表示双栏会合并成单栏显示图片(单栏模板就没有区别了)。为了方便更改模板,建议想要大图的使用带*的。


 2164
2164

 被折叠的 条评论
为什么被折叠?
被折叠的 条评论
为什么被折叠?
 到【灌水乐园】发言


